SPARKSQL RDF Benchmark.
A systematic Benchmarking on the performance of Spark-SQL for processing Vast RDF datasets
- Home
- Bench-Ranking
- Ranking Criteria
- Ranking Goodness
- Project Source Code
- Results
- Benchmark Datasets
- Download Logs
This project is maintained by DataSystemsGroupUT
Bench-Ranking: First Step Towards Prescriptive Analyses of Spark-SQL Distributed RDF Data Processing
Intro.
Leveraging Big Data (BD) processing frameworks like ApacheSpark-SQL to process large-scale RDF datasets holds a great interest inoptimizing the query performance.
Modern BD services are yet; complicated data systems, where tuning the configurations notably affectsthe performance.
Benchmarking different frameworks and configurationsprovides the community with best practices towards selecting the mostsuitable configurations.
However, most of these benchmarking efforts areclassified as descriptive, diagnostic, or predictive analytics.
There is still lack of prescriptive and quantitative analytics in benchmarking BD applications and systems. Bench-ranking takes the first steps in filling this timely research gap.
In particular, we show the value of prescriptive ranking criteria for evaluating RDF processing systems based on Big Data frameworks.
We validated our proposals with a case-study on Apache Spark-SQL that includes several varying dimensions, i.e. three relational schemata, three partitioning techniques, and five storage backends.
Selecting the best configuration combination out of this complex solution space is not an easy task.
The proposed ranking criteria provide an accurate yet simple way that supports the practitioners in this task even in the existence of dimensions’ trade-offs.
Table of contents:
Gartner's Analysis Framework:
Here, we reflect on the gap of performance analysis in existing works that use Big Data frameworks for RDF processing. In particular, we narrow down by discussing the problem of performance analysis alongside a well-known decision-making framework from Gartner shown below.
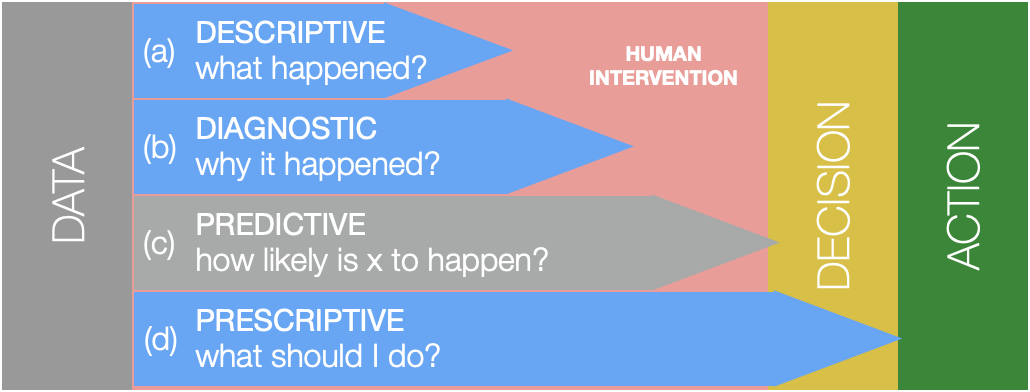
Descriptive analysis:
This level of analysis allows answering factual questions, e.g., ‘what happened?’. This kind of analysis extrapolates fine-grain observations that describe a phenomenon through different metrics that could capture its relevant dimensions. However, all the work to transform such observations into insights is a subject of the decision maker.
Diagnostic analysis:
This level reduces the amount of human intervention by combining the observed data with the domain knowledge and, thus, enabling answering explanatory questions like ‘why it happened?’. At this level, factual knowledge is contextualized to produce a diagnosis. Typically, diagnostic analysis requires an exploratory phase on existing data and data enrichment.
Predictive analysis:
This level aims to forecast future results, and explain drivers of the observed phenomena using machine learning or data mining techniques. This level of analysis is out of the scope of our project.
Prescriptive analysis:
This level reduces the need for human intervention even further by making the insight actionable. In practice, the prescriptive analysis relies on statistical and mathematical models that aid in answering the question of ‘what should be done?’. Regard benchmarking, the prescriptive analysis provides the criteria for selecting the best possible approach given.
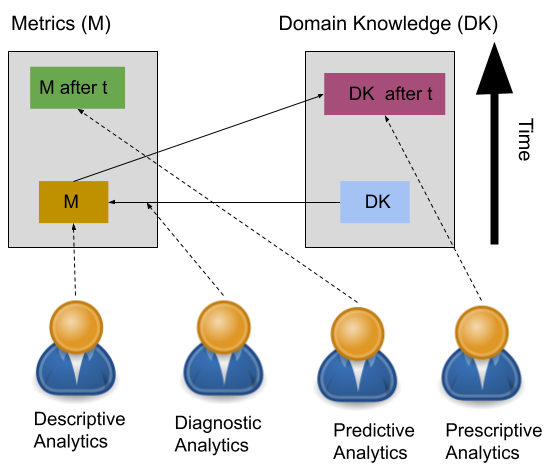
In other words, when we mention the process of decsion making, it is higly related with the data analyisis. The data analyisis really depends on what time this analyisis is avaiable in. Thus, the availiabiilty of data analyisis and its time factor is important in decsison making process.
- For example, when we have some measurements that already happended in the past, now we are in the descriptive analysis level.
- If we employ the Domain Knoweledge (DK) aiming to find explanations for the oservations found from the past desciptive analytics, now we are in the diagnostic analysis level.
- When we employ forecasting and ML models in order to expect what is likely to happen after time (t) in the future, we are digging into the level of predictive analysis.
- For the future, if we decided based on statsical and mathematical models what should we do regarding the phenomena, we are in the Prescriptive Analytics.
Motivating Example:
Descriptive Analyis present fine-grain observations about the query performance as well as stating which dimentsion is winning (i.e outperforming the others). This level was followed by the some diagnosis that describe why this happened (e.g, why VT is in general the best performing relational schema). However, these descriptive and diagnostic analyises can’t give final answers as we contrdictions indeed occur. Therefore, decision at this level is tricky.
| Q1 | Q2 | Q3 | Q4 | Q5 | Q6 | Q7 | Q8 | Q9 | Q10 | Q11 | |
|---|---|---|---|---|---|---|---|---|---|---|---|
| 100M | c.i.2 | b.ii.3 | c.ii.3 | a.ii.3 | b.ii.4 | c.ii.3 | b.ii.1 | c.iii.4 | b.ii.4 | b.iii.3 | b.i.3 |
| 250M | c.ii.2 | b.ii.4 | c.ii.4 | c.ii.1 | b.ii.4 | c.ii.3 | b.ii.4 | c.iii.4 | b.iii.3 | b.iii.3 | b.ii.4 |
| 500M | c.ii.2 | b.iii.4 | c.ii.3 | a.ii.3 | b.iii.3 | c.ii.3 | b.ii.4 | c.iii.4 | b.iii.4 | b.iii.3 | b.i.3 |
For example, the table shown above represents the best configurations for each query and each dataset size. A motivation scenario was triggered by analyzing these results, showing no conclusive dimensions to be the most suitable performer. The experiment results over different settings also show no decisive configuration setting over the assessed dimensions (i.e., relational schema, partitioning technique, and storage backend), making the practitioner selecting setup a complex task.
Bench-Ranking Criteria
Motivated by the limitations of descriptive and diagnostic analyses, we advocate for indicators such as applying ranking techniques for these dimensions.
Prelimenary Definitions:
Definition 1: (Ranking Score): The ranking score R is a numerical value that represents the performance of an element in a set. Given two elements i and j, and Ri, Rj their ranking score, we say that i has a higher rank than j (i.e., i outperforms j) iff Ri> Rj.
For isntance, we will use a simple running example, based on our motivating scenario, i.e., we consider a set of three configurations [a.i.1,b.ii.2,c.iii.3], and a query (Q1) of the SP2B benchmark. A valid ranking score can be the time required for execution Q1 by each of the selected configurations (in milliseconds) are equal to 30, 50, and 40, respectively. The association with each configuration with its ranking score happens according to the query evaluation (runtimes). We can generalize this by introducing the notion ofranking function.
Definition 2:(ranking function): Let E is the input list of elements to be ranked, the ranking function fR is a function E→ R that associatesa ranking score to every element in E .
Considering the ranking scores above, the configuration set E can be sorted to produce the sorted set R=[a.i.1, c.iii.3,b.ii.2]. Intuitively, the lower the execution time, the better. More formally, we denote R as a rank set.
Definition 3 (Rank Set) :A rank set R is an ordered set of element sordered by a ranking score. The rank index ri is the index of a ranked elementiwithin a ranking setR, i.e., R[ri]=i. Wed enote with the left most (top-ranked) subset of R of length k, and we denote with Rx the rank set calculated accordingto the Rank score R_x.
- Example on the ranking functions (Ranking configurations according to Query runtimes):
The below table shows an example the actual query ranks of the configurations according to query runtimes for the 100M dataset, e.g., a.i.1 is at the 29th rank for running Q1.
| Conf. | Q1 | Q2 | … | Q10 | Q11 |
|---|---|---|---|---|---|
| a.i.1 | 29th | 28th | … | 19th | 25th |
| a.i.2 | 33th | 36th | … | 30th | 32th |
| … | … | … | … | … | … |
| b.iii.4 | 11th | 35th | … | 5th | 8th |
| … | … | … | … | … | … |
| c.iii.4 | 36th | 33th | … | 36th | 36th |
Proposed Ranking Criteria
Genralized Ranking criteria inspiered by ranking partitioning techniques proposed by akhter2018empirical. We extend this partitoning ranking to cover other two dimensions, mamely, the RDF Relational schemata,and Storage backends.
Experiments show that the single-dimensional ranking criteria are optmizing one dimension at a time. Indeed, they ignore dimension’s tradeoffs. To identify which configuration is the best performing, we need to optimize along all the dimensions simultaneously. In practice, this means designing a multi-dimensional ranking criteria. This intuition leads to extend the Bench-ranking into a multiobjective optimization problem in order to optimize all the dimensions at the same time.
How to assess the opted ranking criteria ("Bench-Ranking Goodness"):
A ranking criterion aims at identifying the configurations that have the overall best results. In practice, We can consider a ranking criterion “good” if it does not suggest a low-performing configuration. In other words, we are not interested to be the best at any particular query as long as we are never the worst. Herein, we discuss how can we measure such goodness, i.e., how to evaluate the ranking measure?. Ranking Goodness Details and Measures.