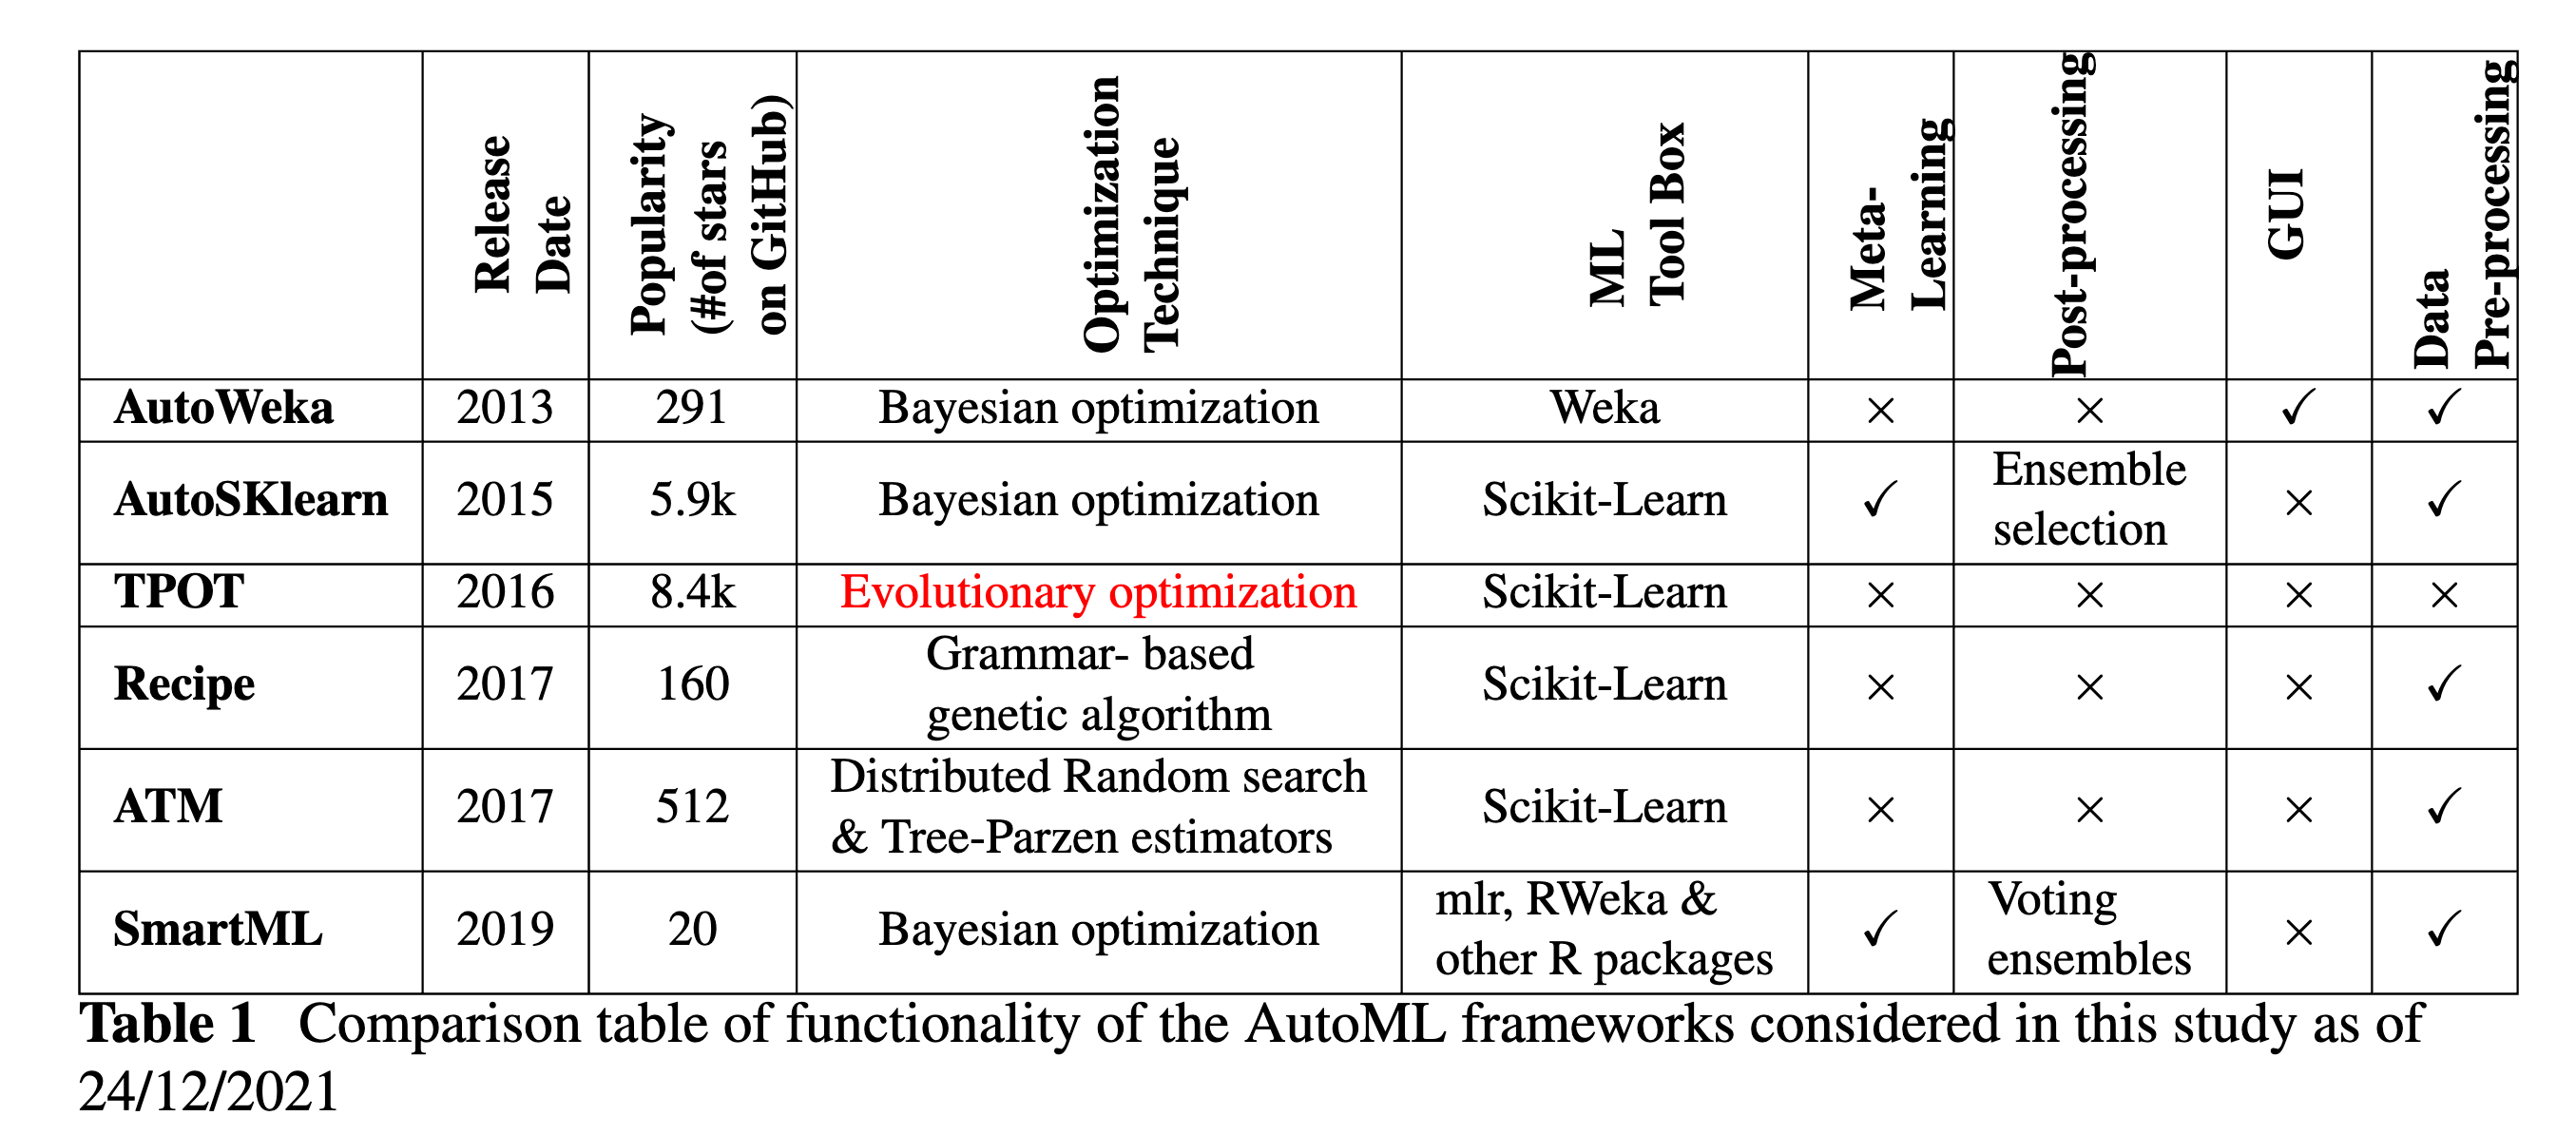
Comparison table of functionality of the AutoML frameworks
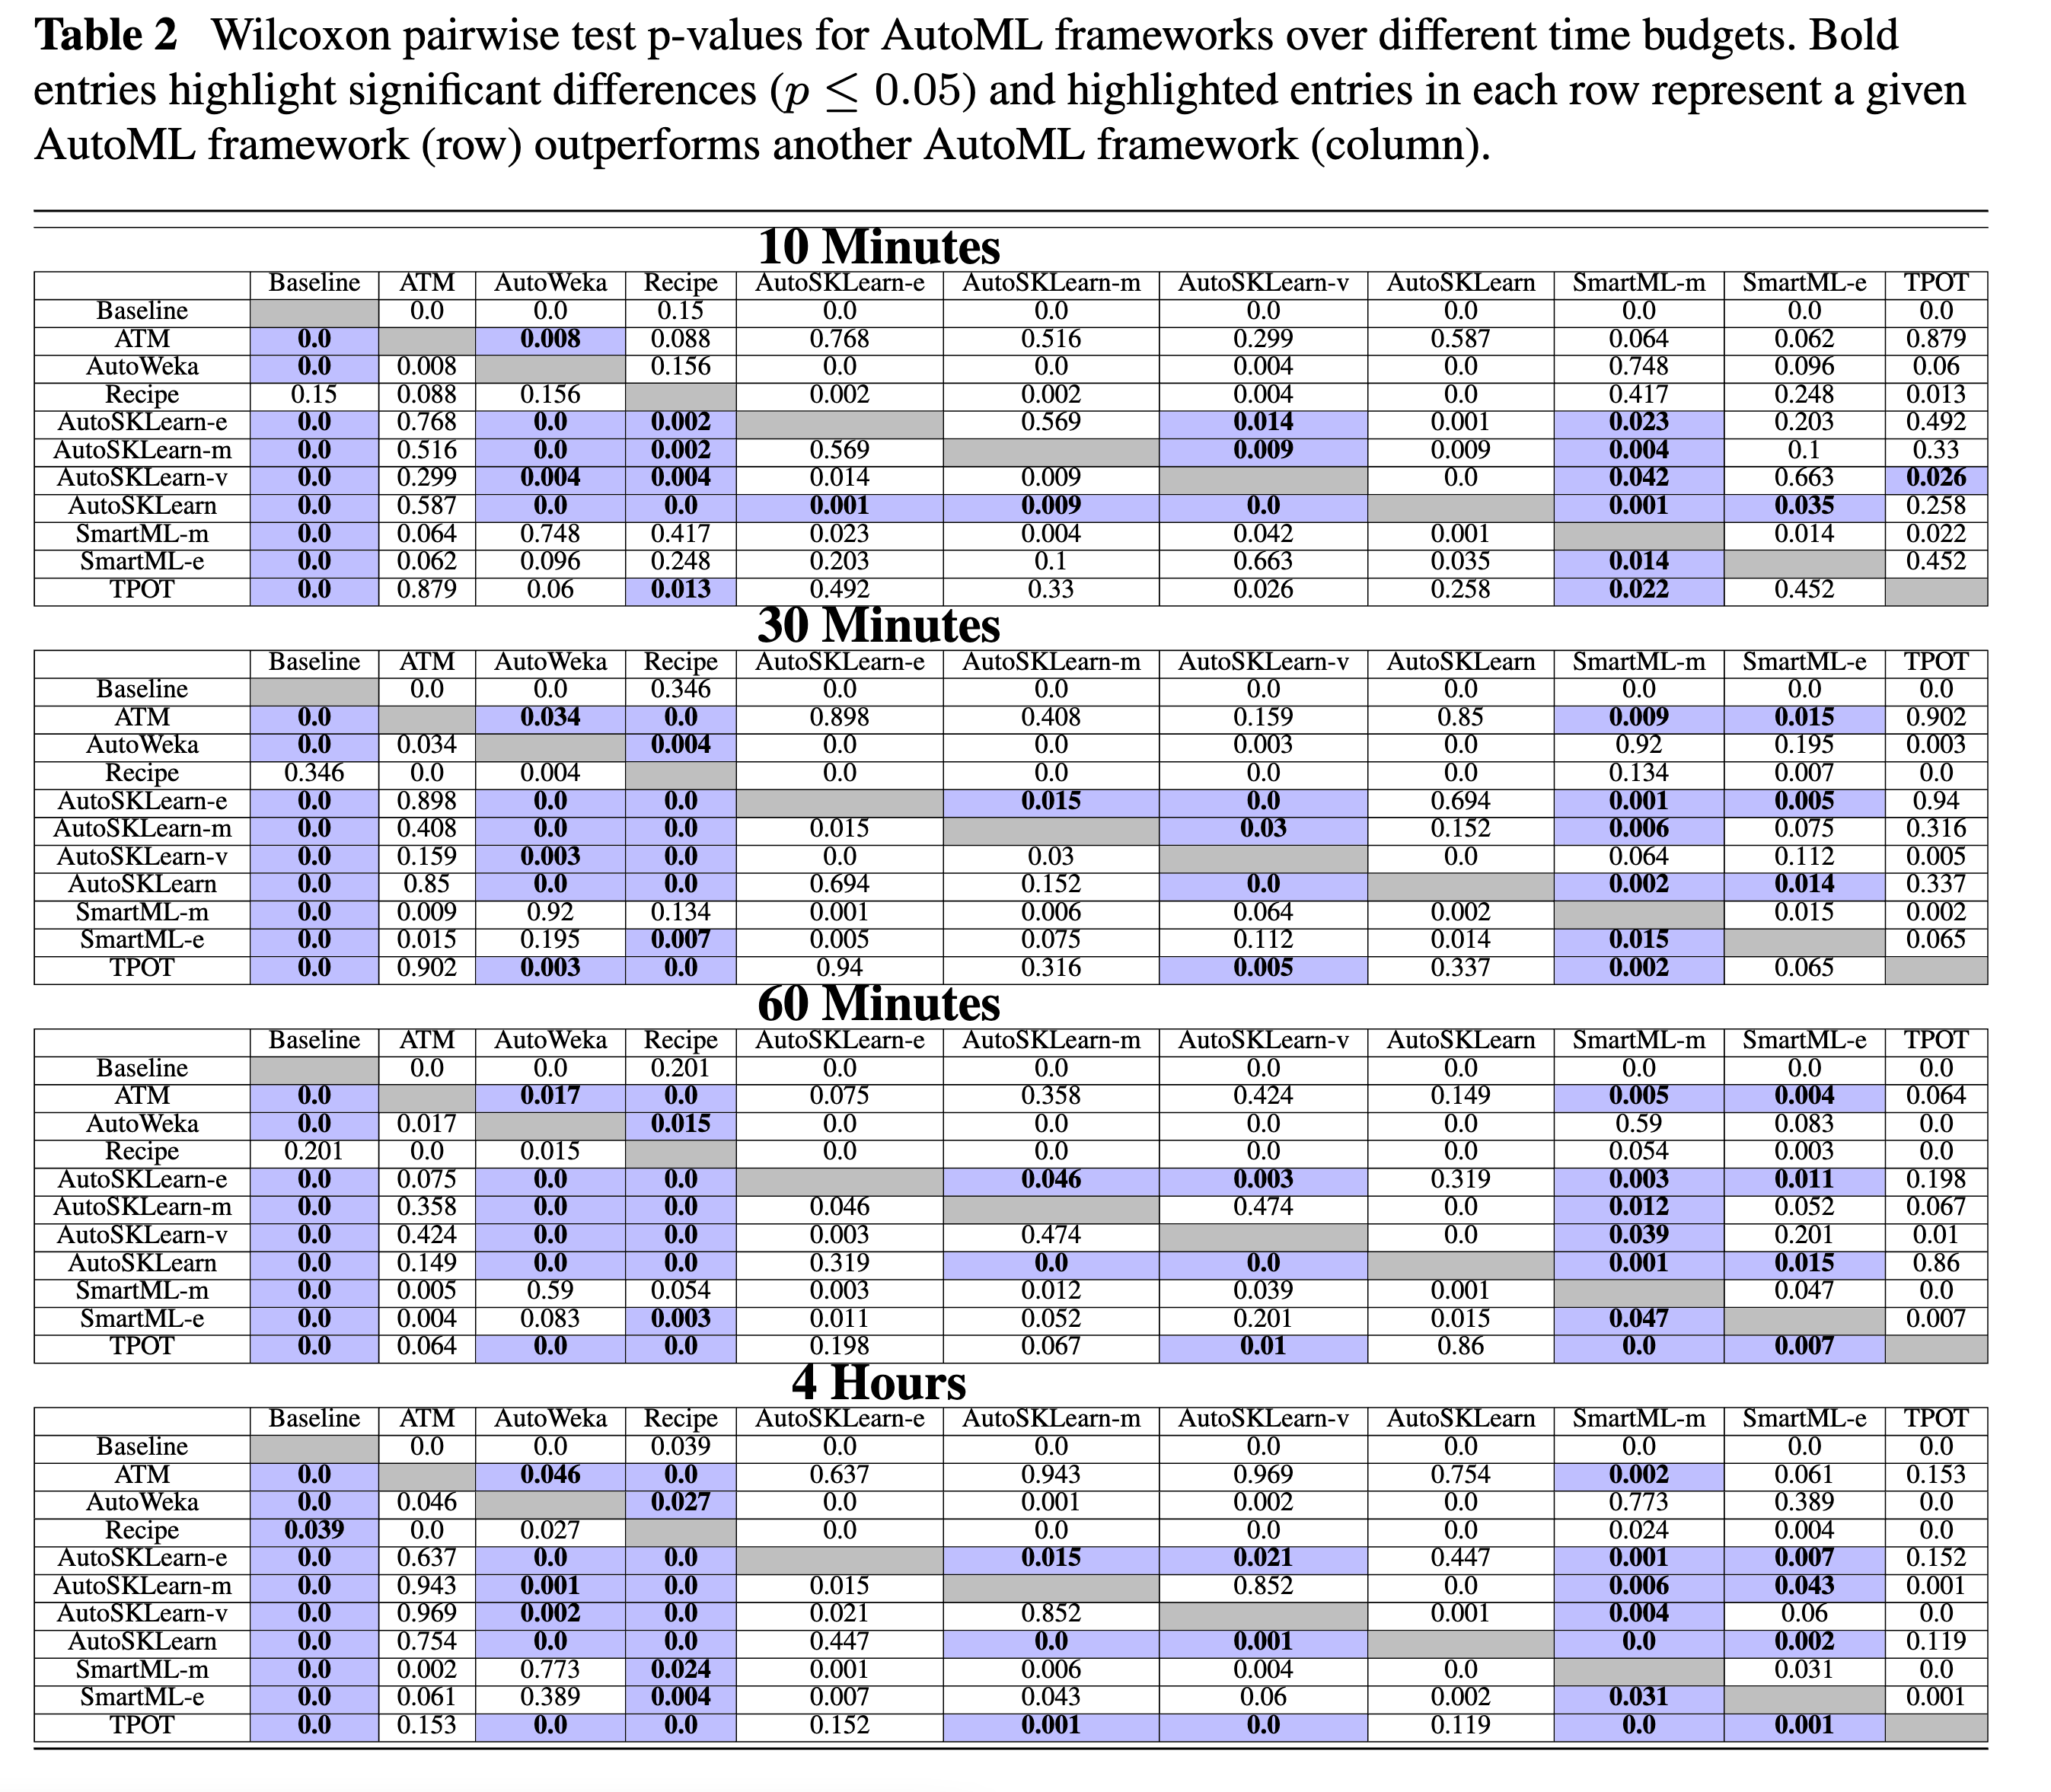
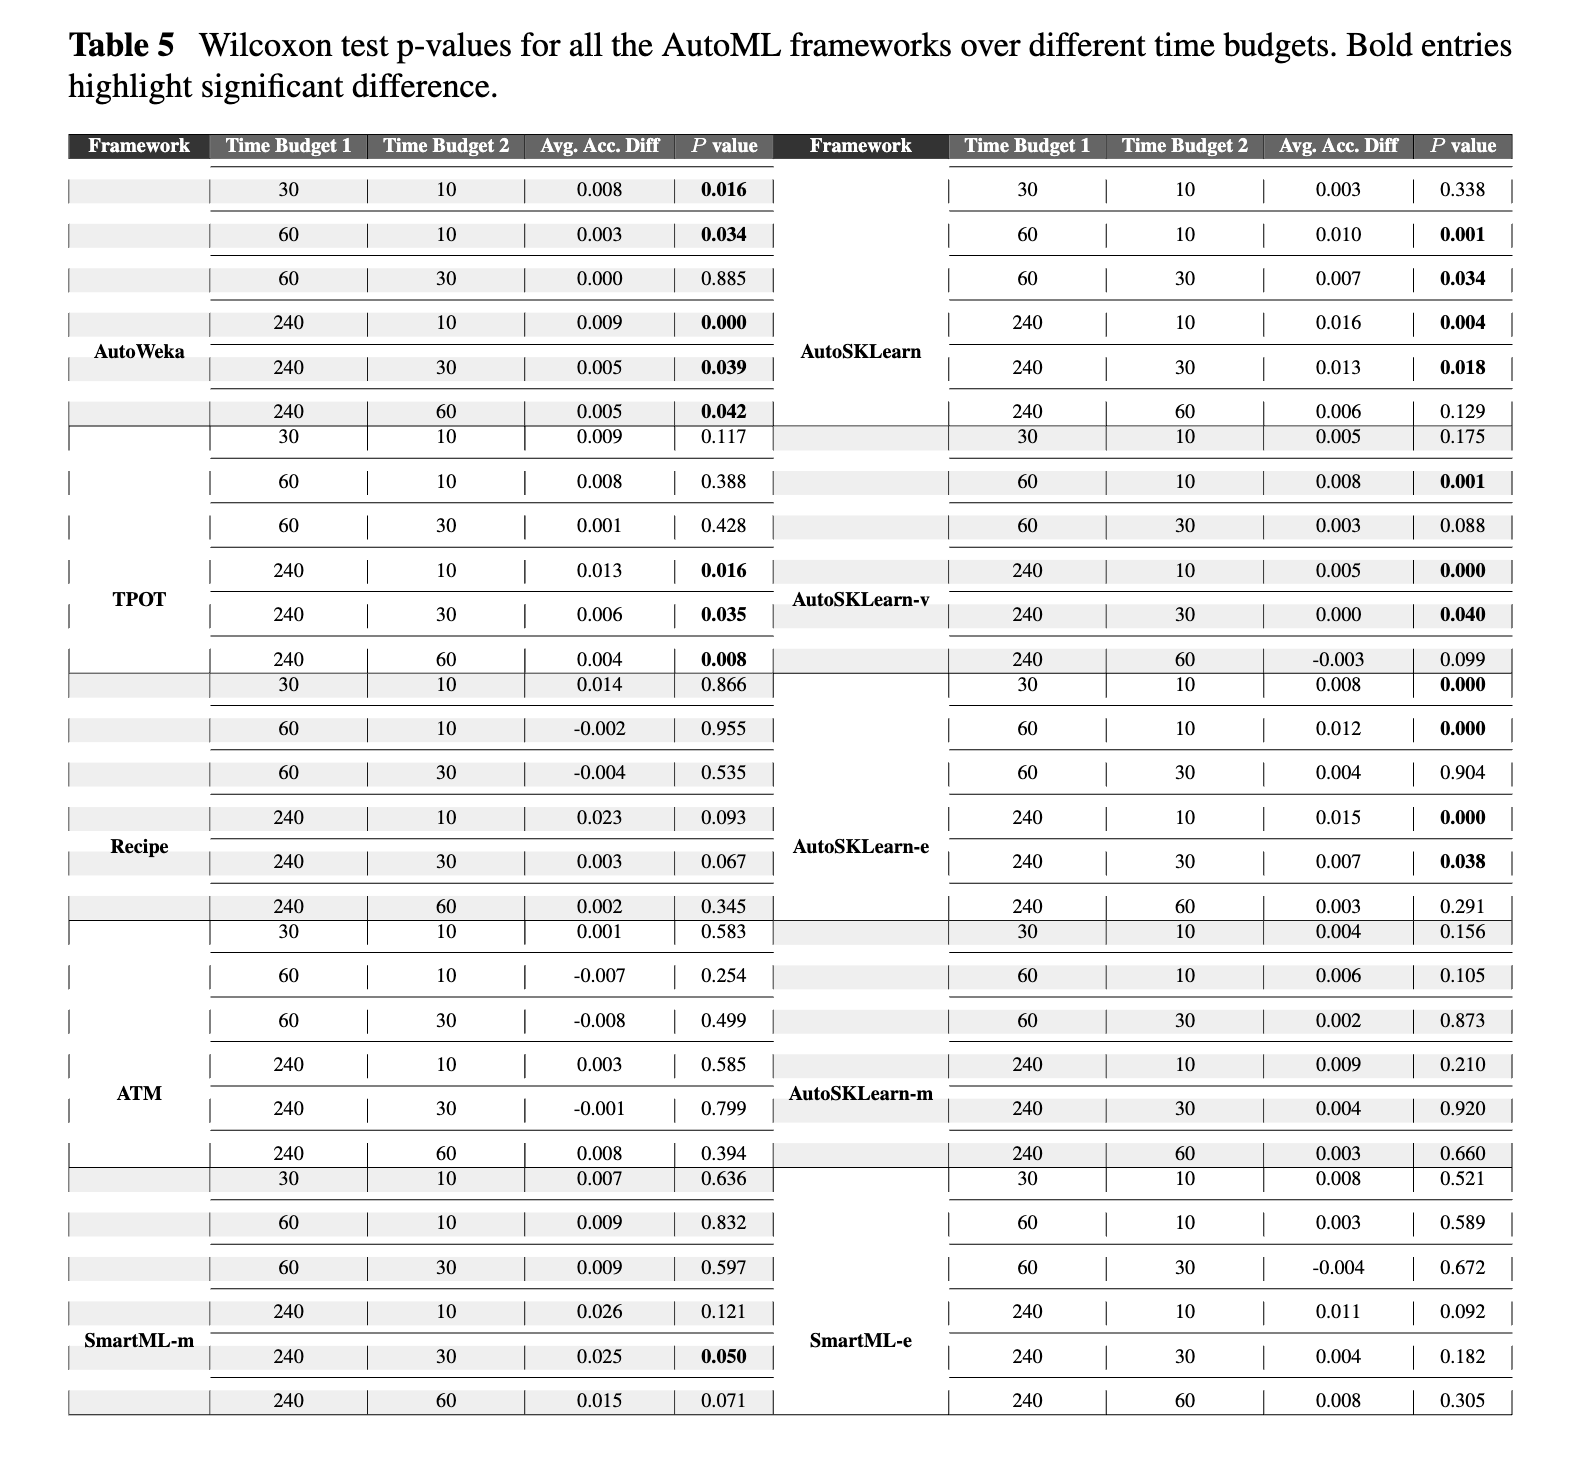
Wilcoxon pairwise test p-values for AutoML frameworks over different time budgets.
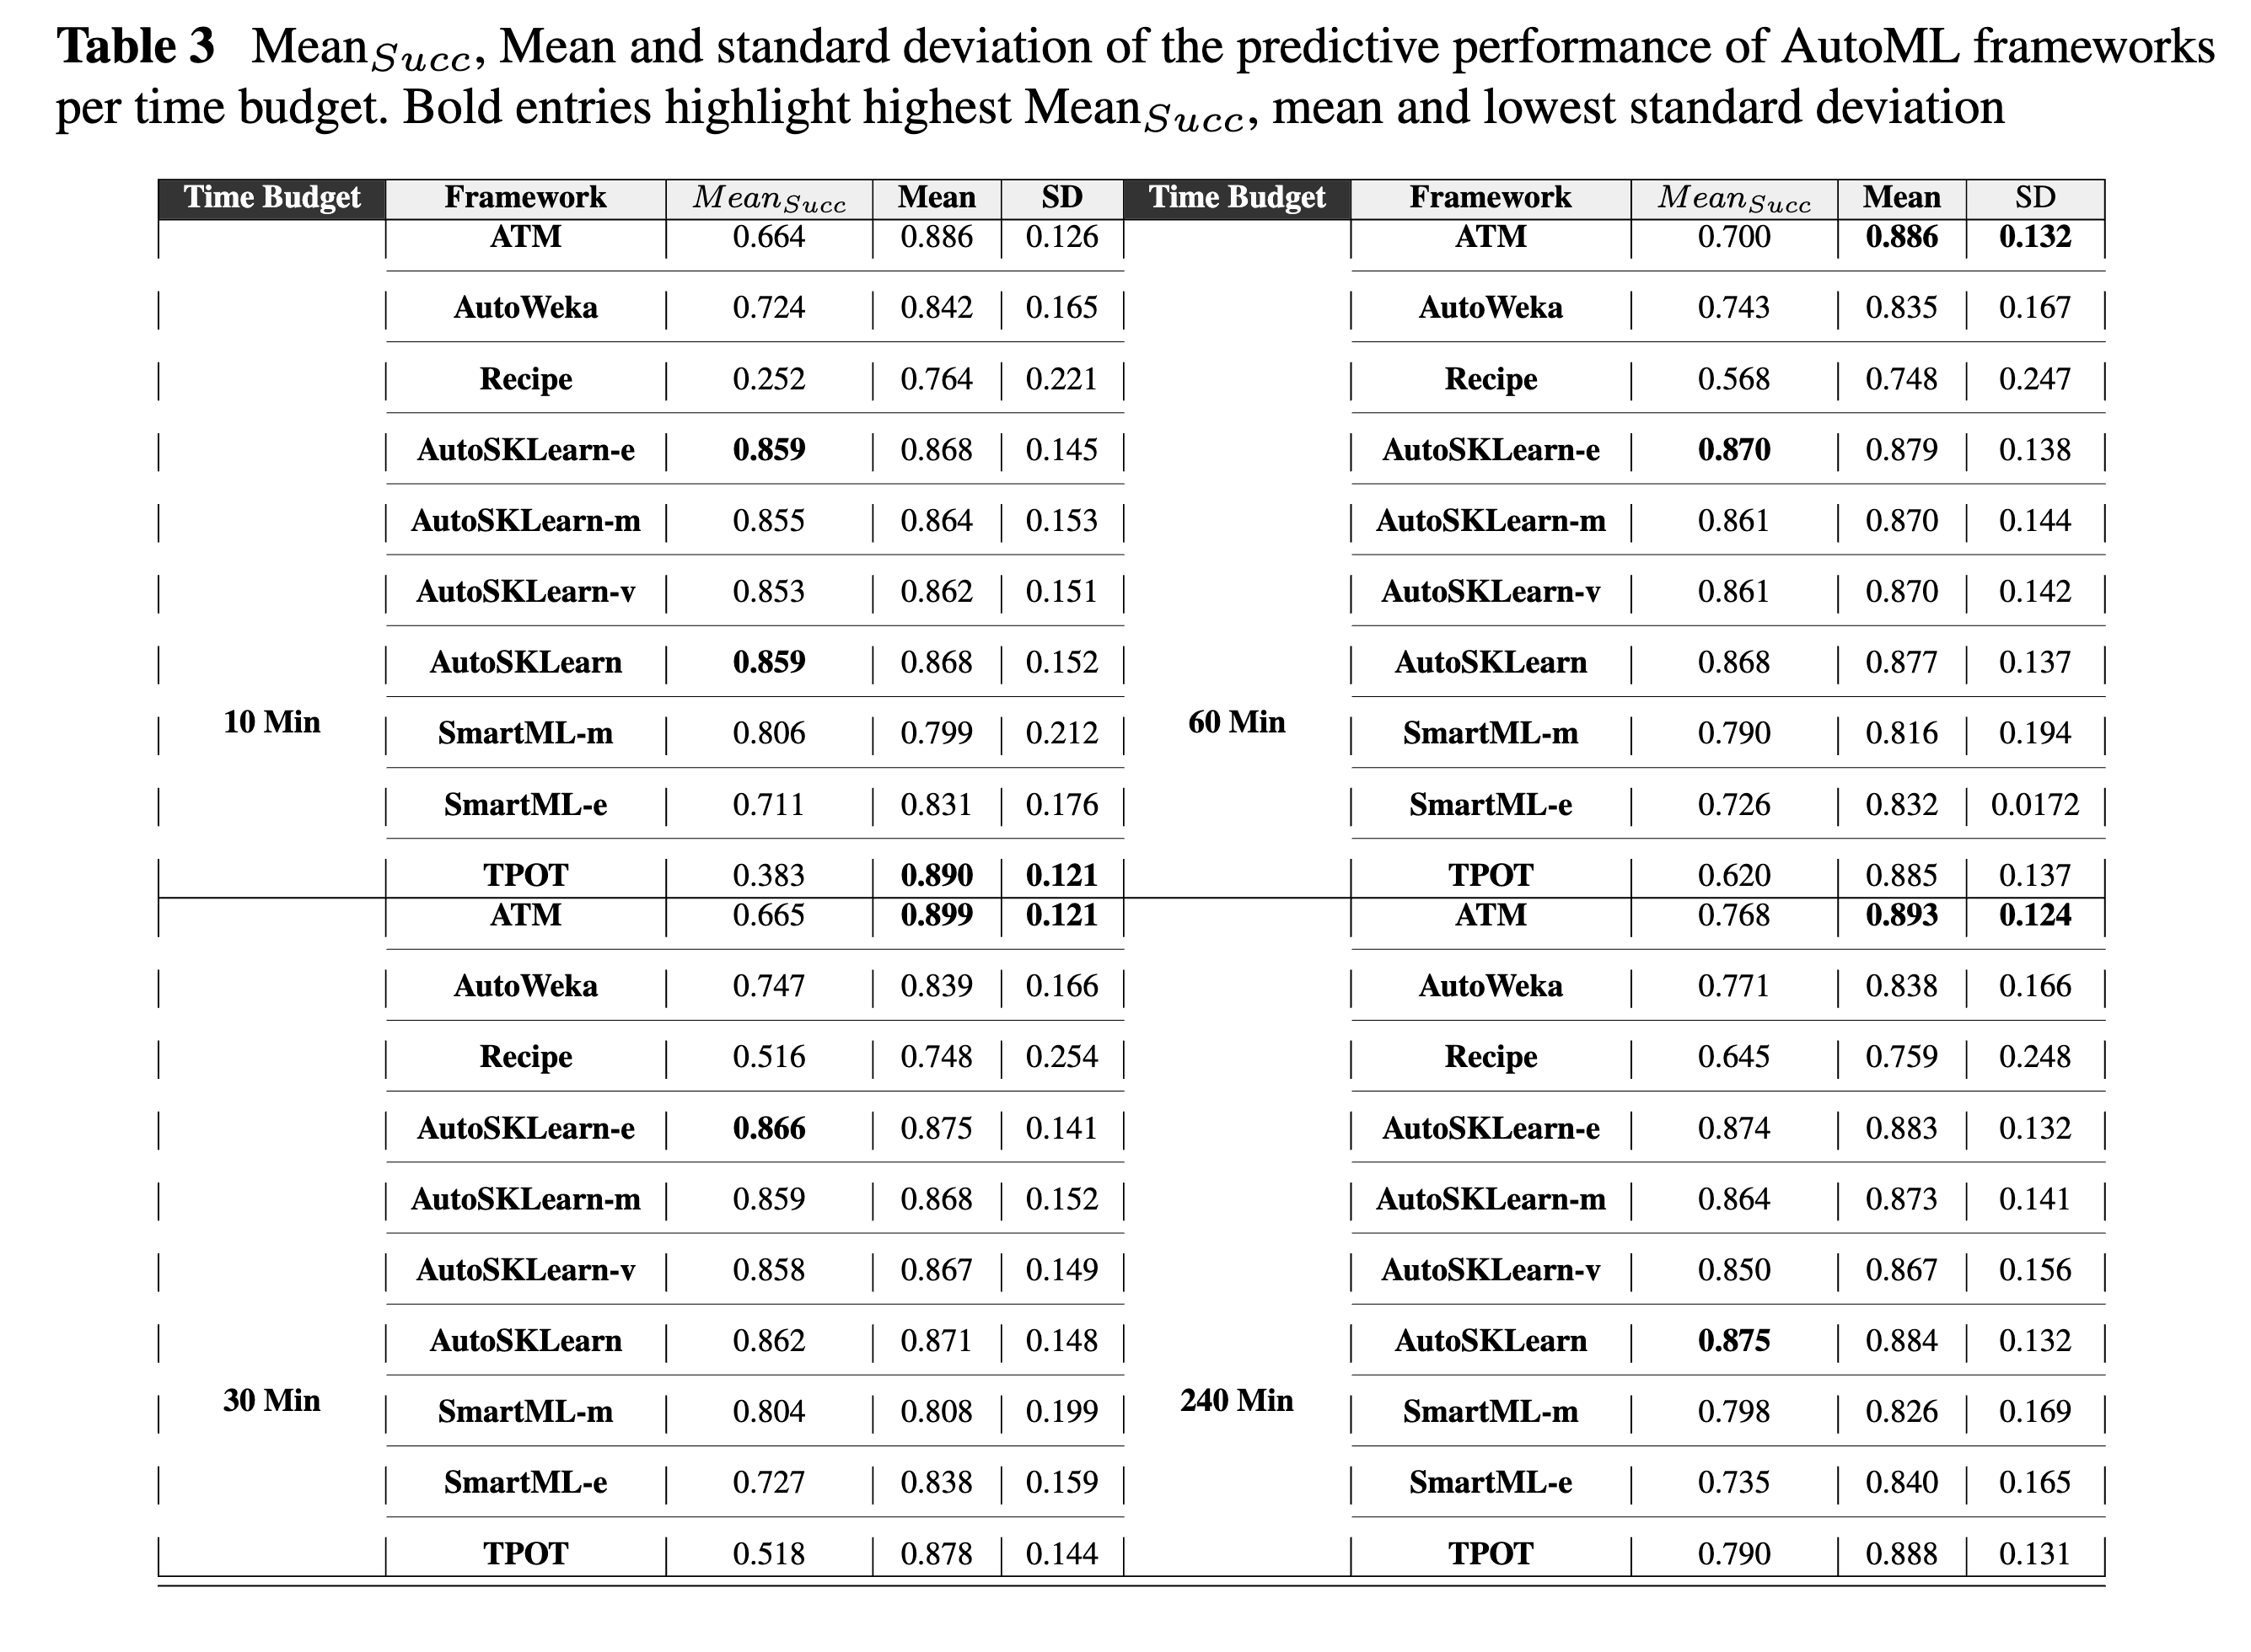
Mean_Succ, Mean and standard deviation of the predictive performance of AutoML frameworks
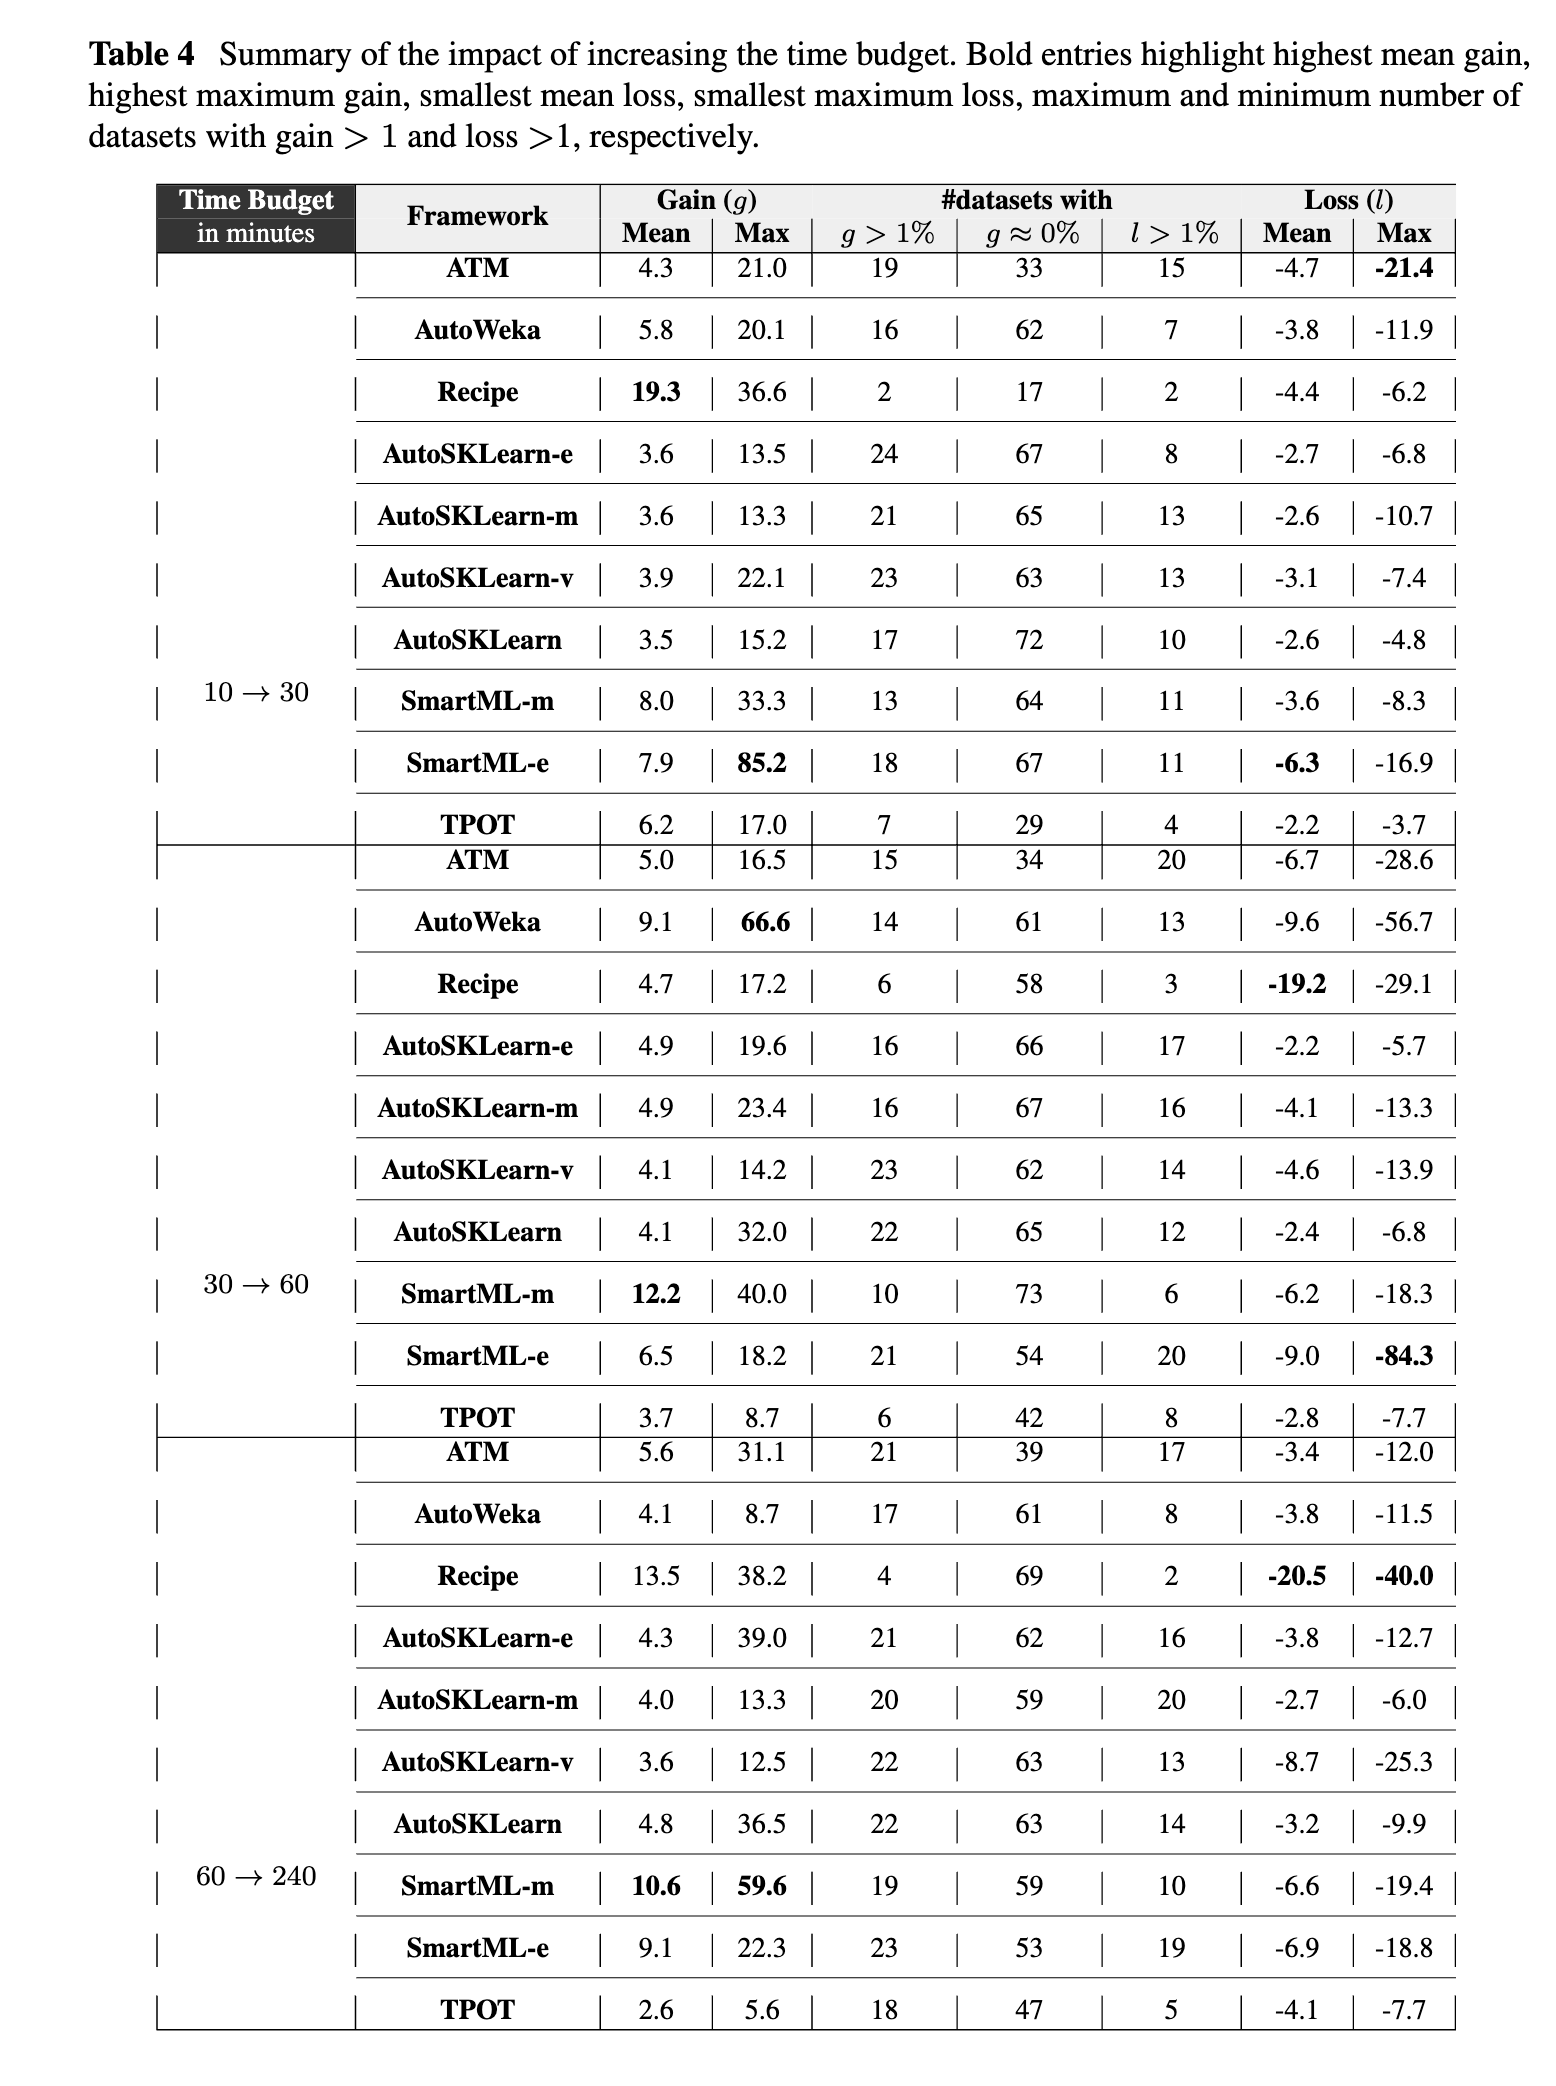
Summary of the impact of increasing the time budget.
Wilcoxon test p-values for all the AutoML frameworks
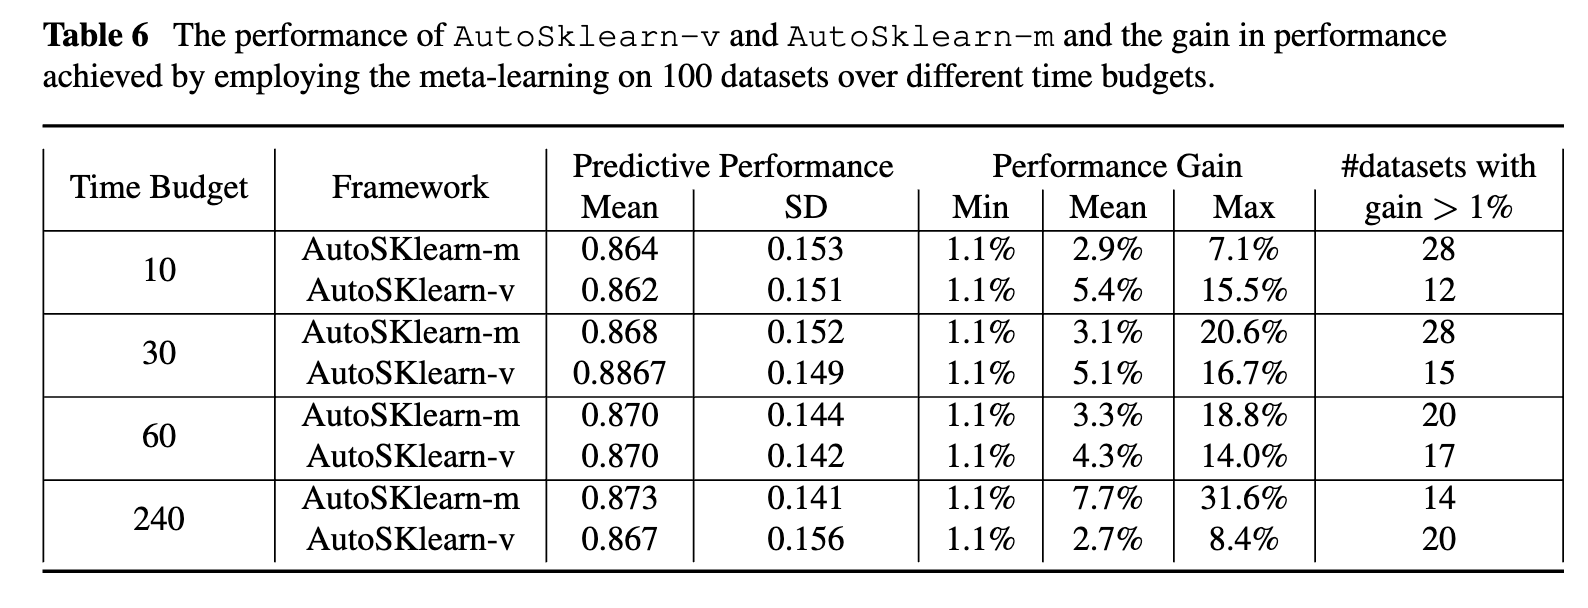
The performance of AutoSklearn-v and AutoSklearn-m and the gain in performance
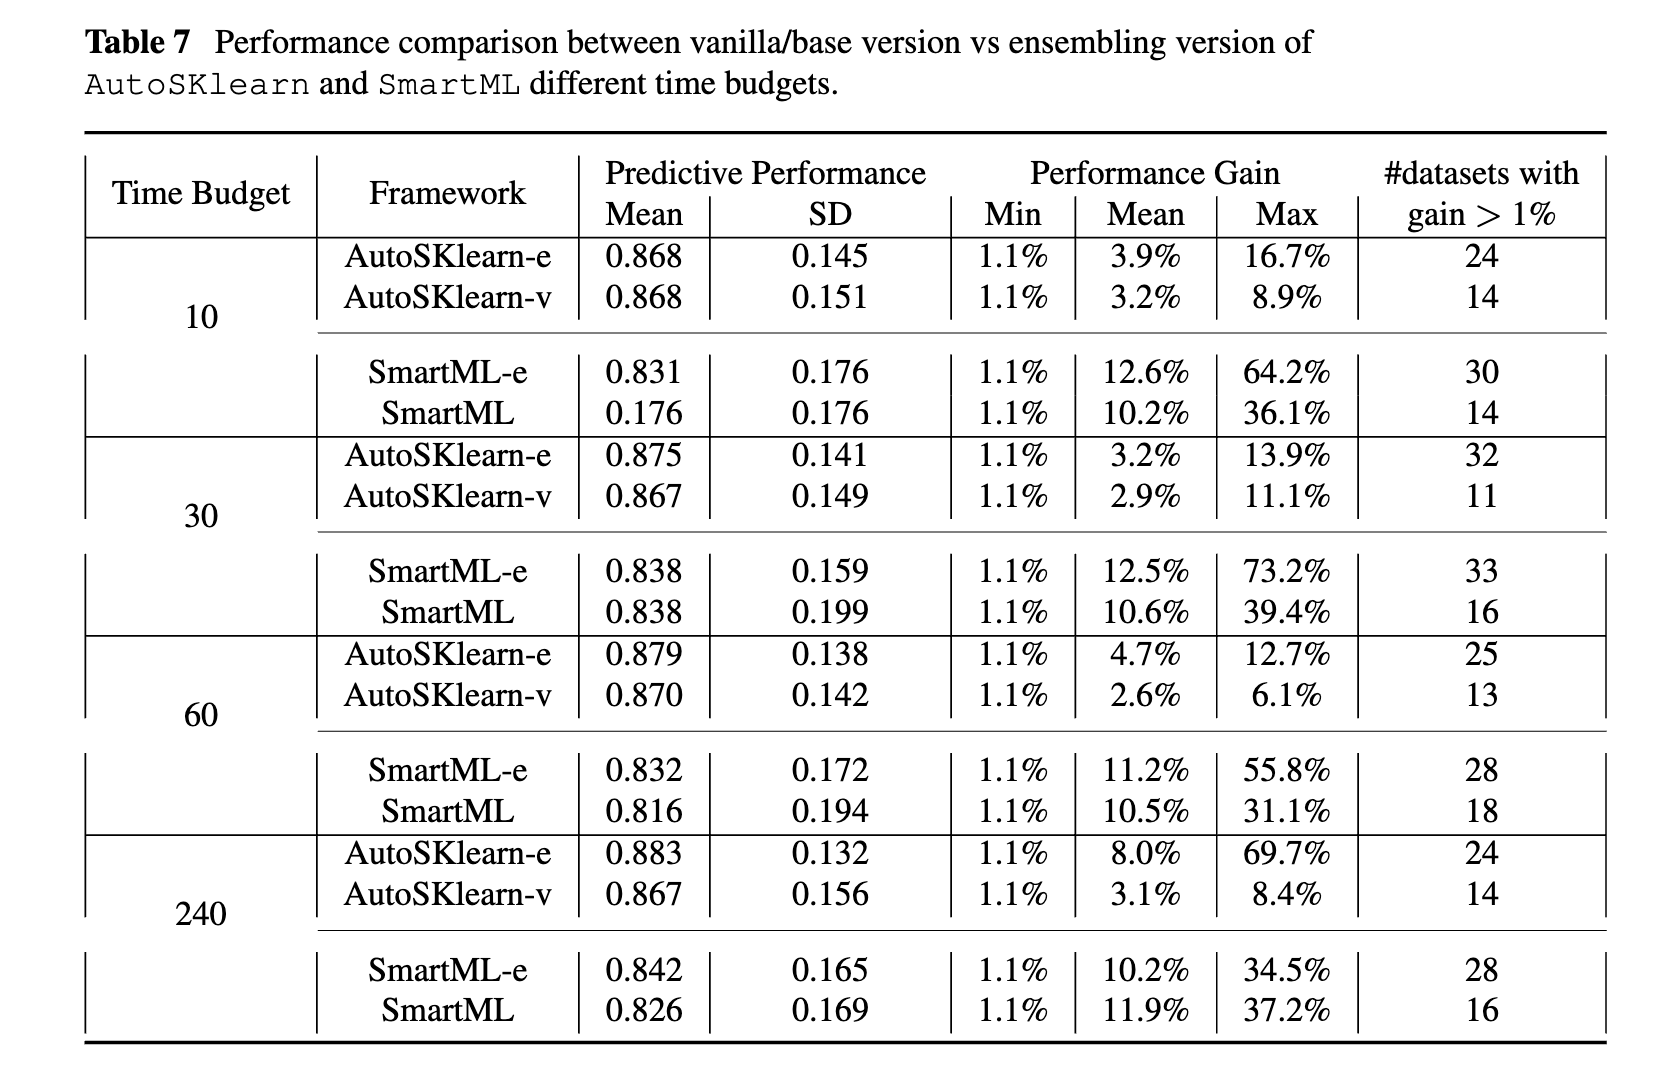
Performance comparison between vanilla/base version vs ensembling version of AutoSKlearn and SmartML
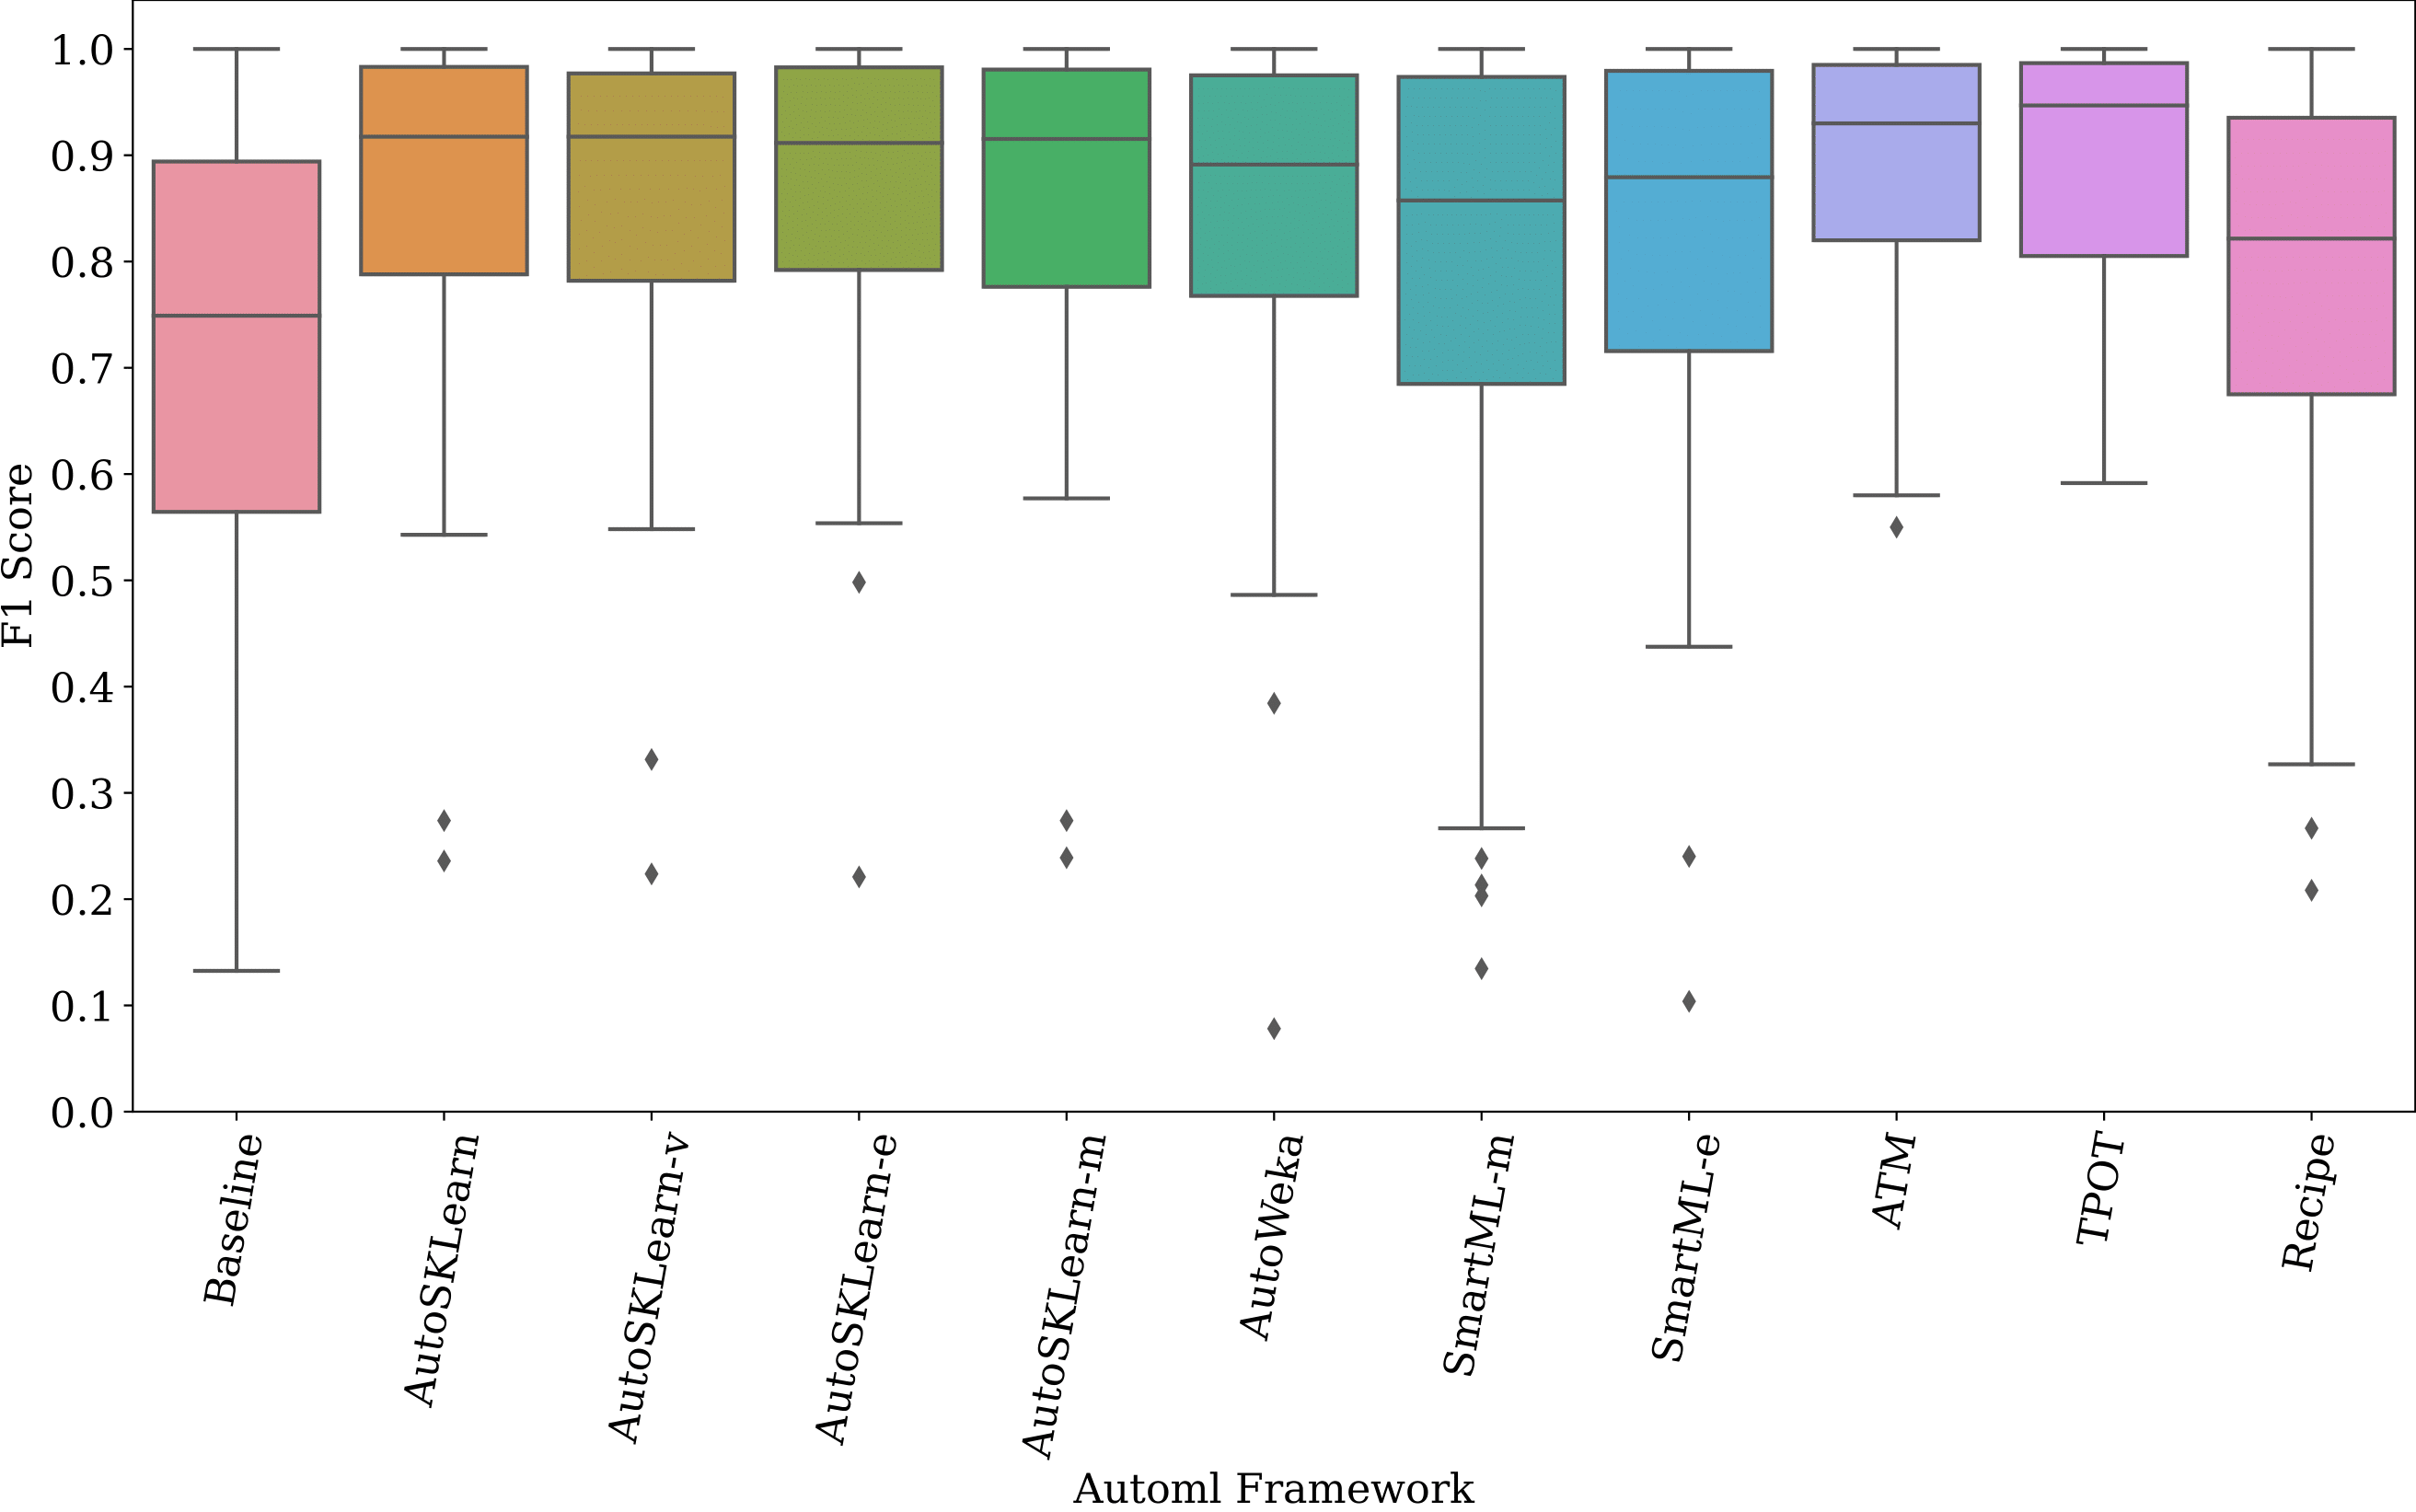
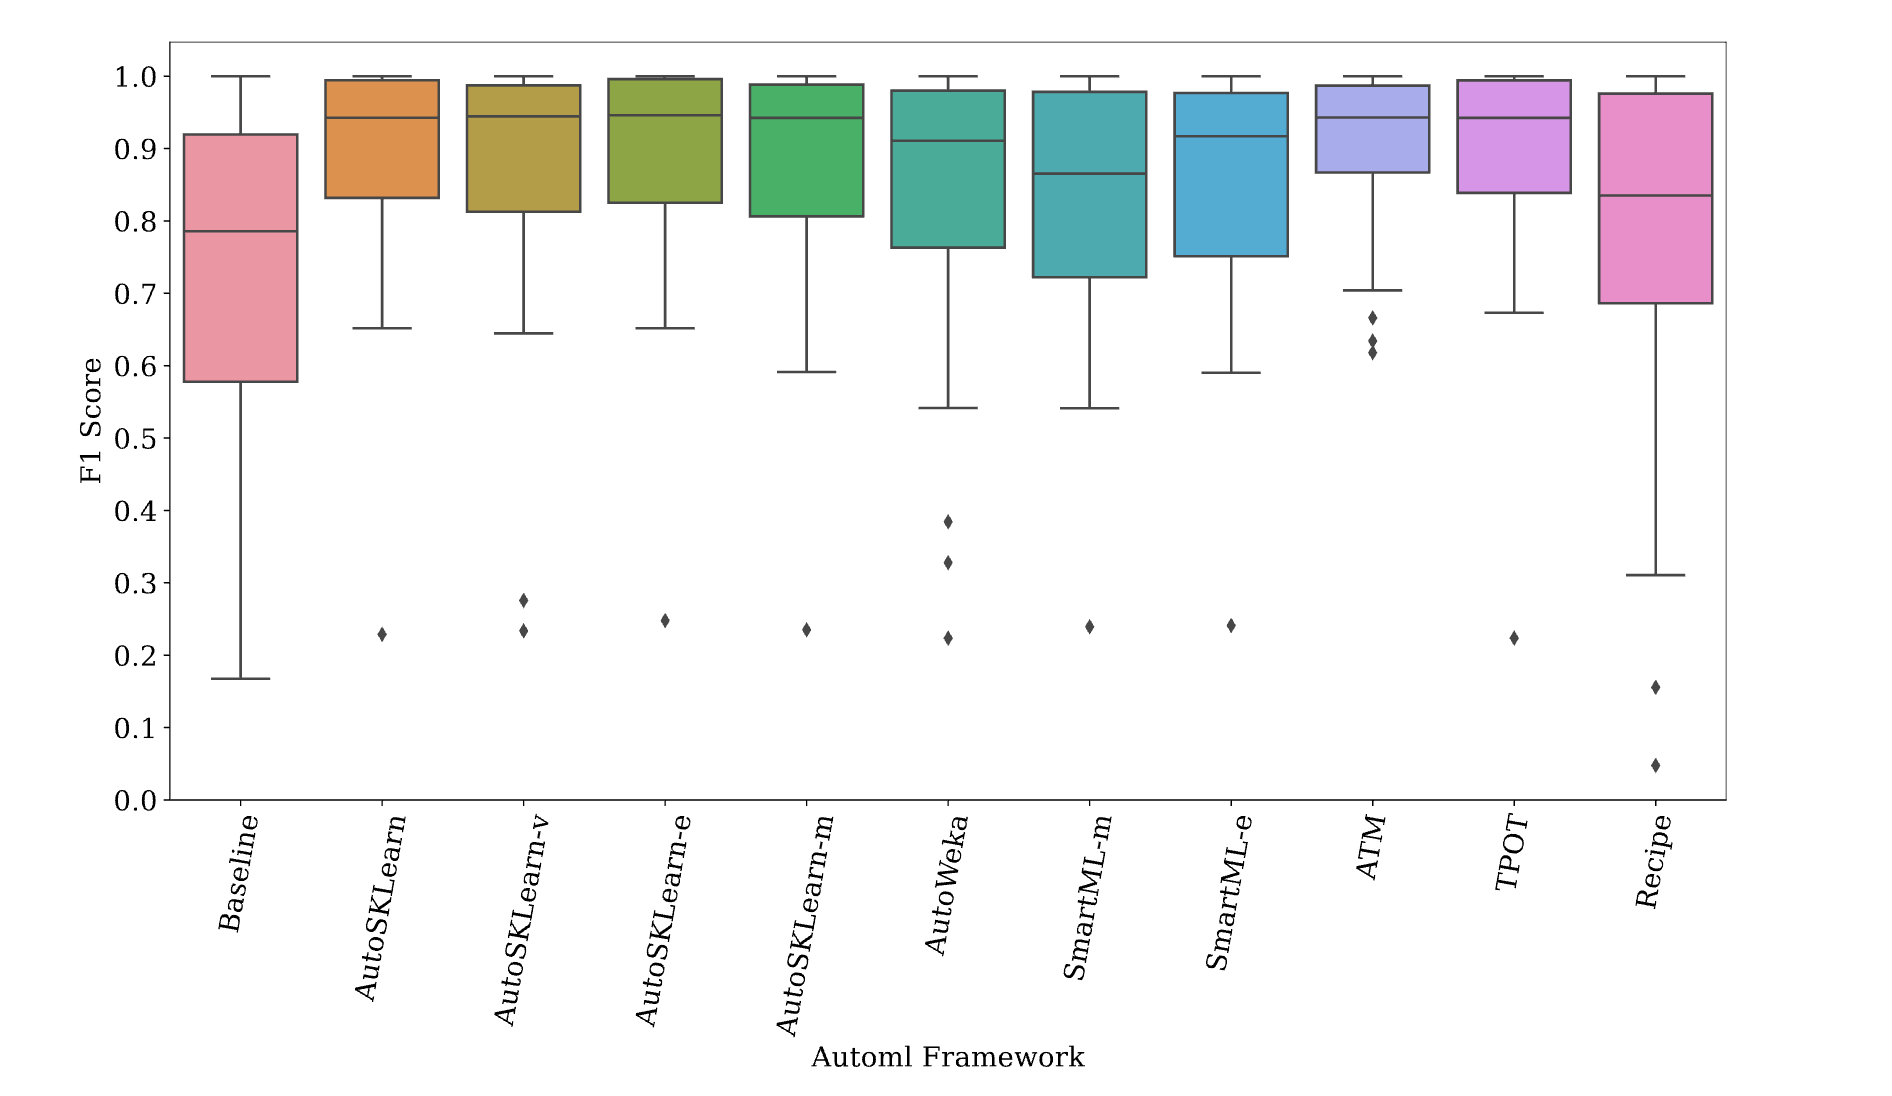
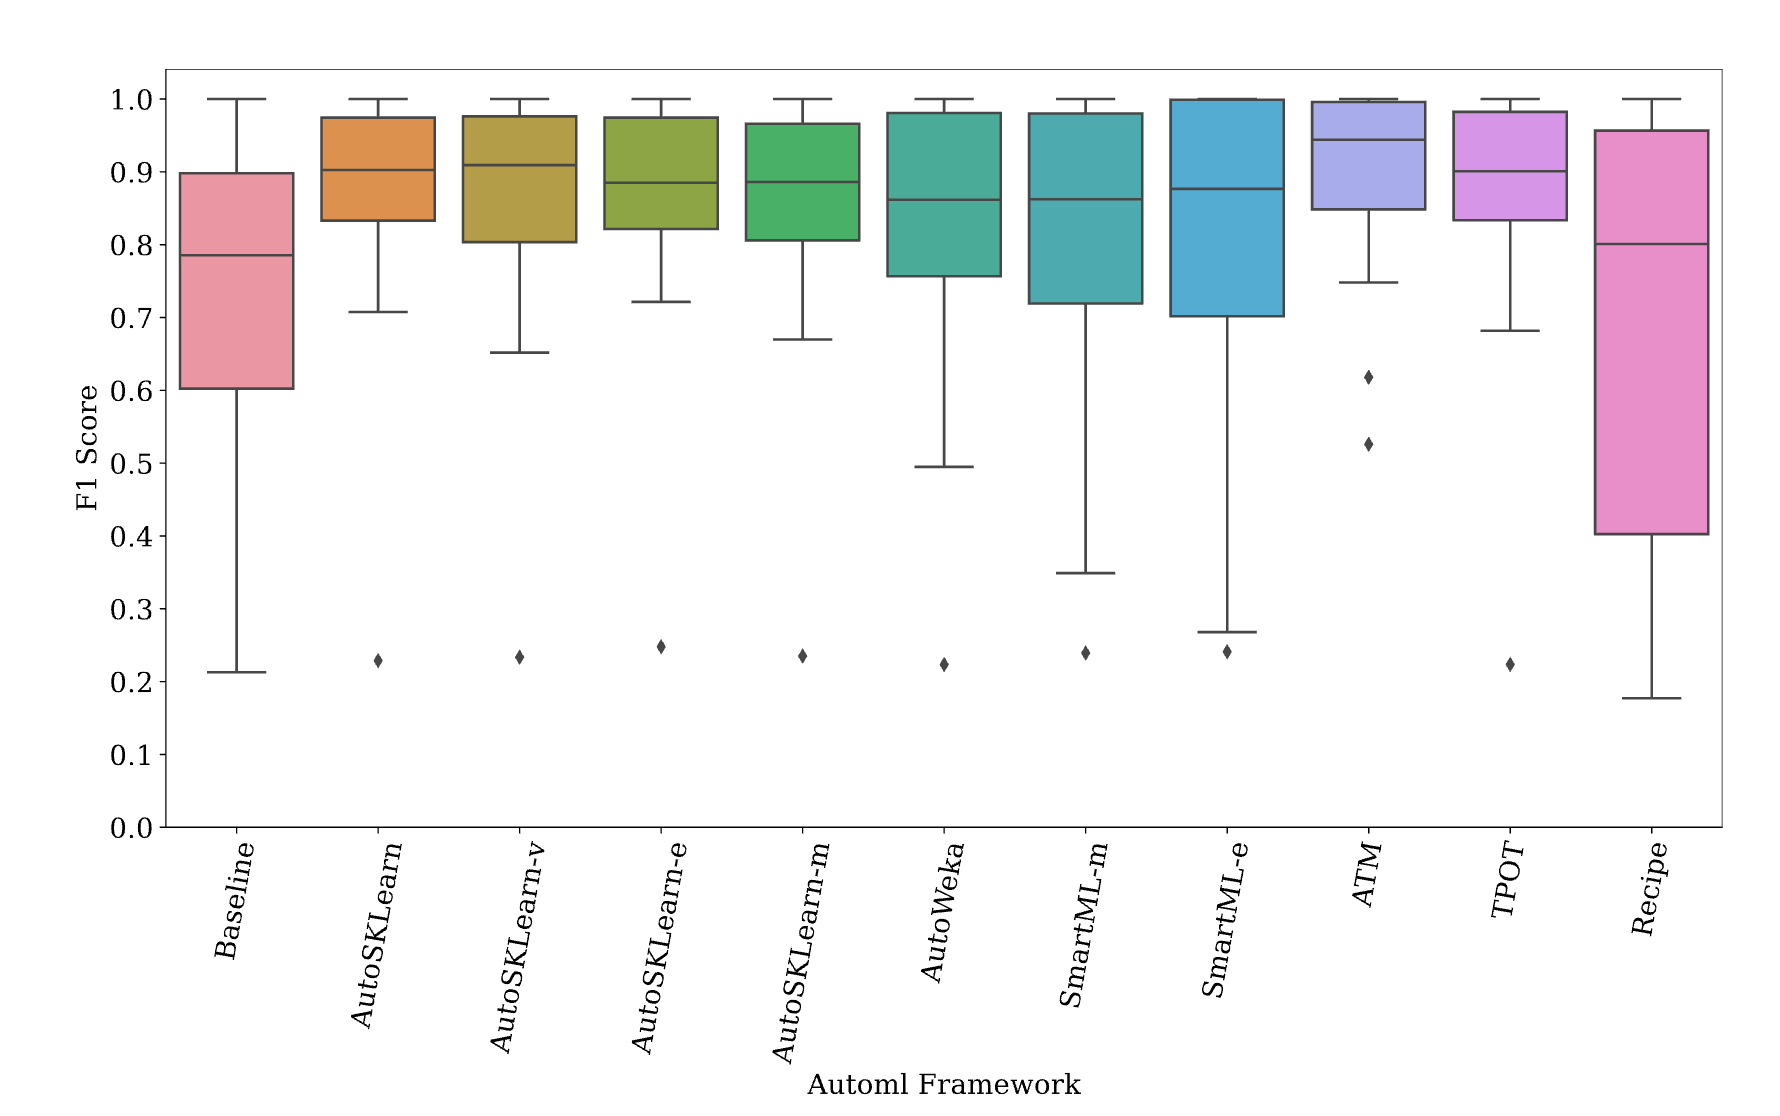
General performance trends of the benchmark AutoML frameworks
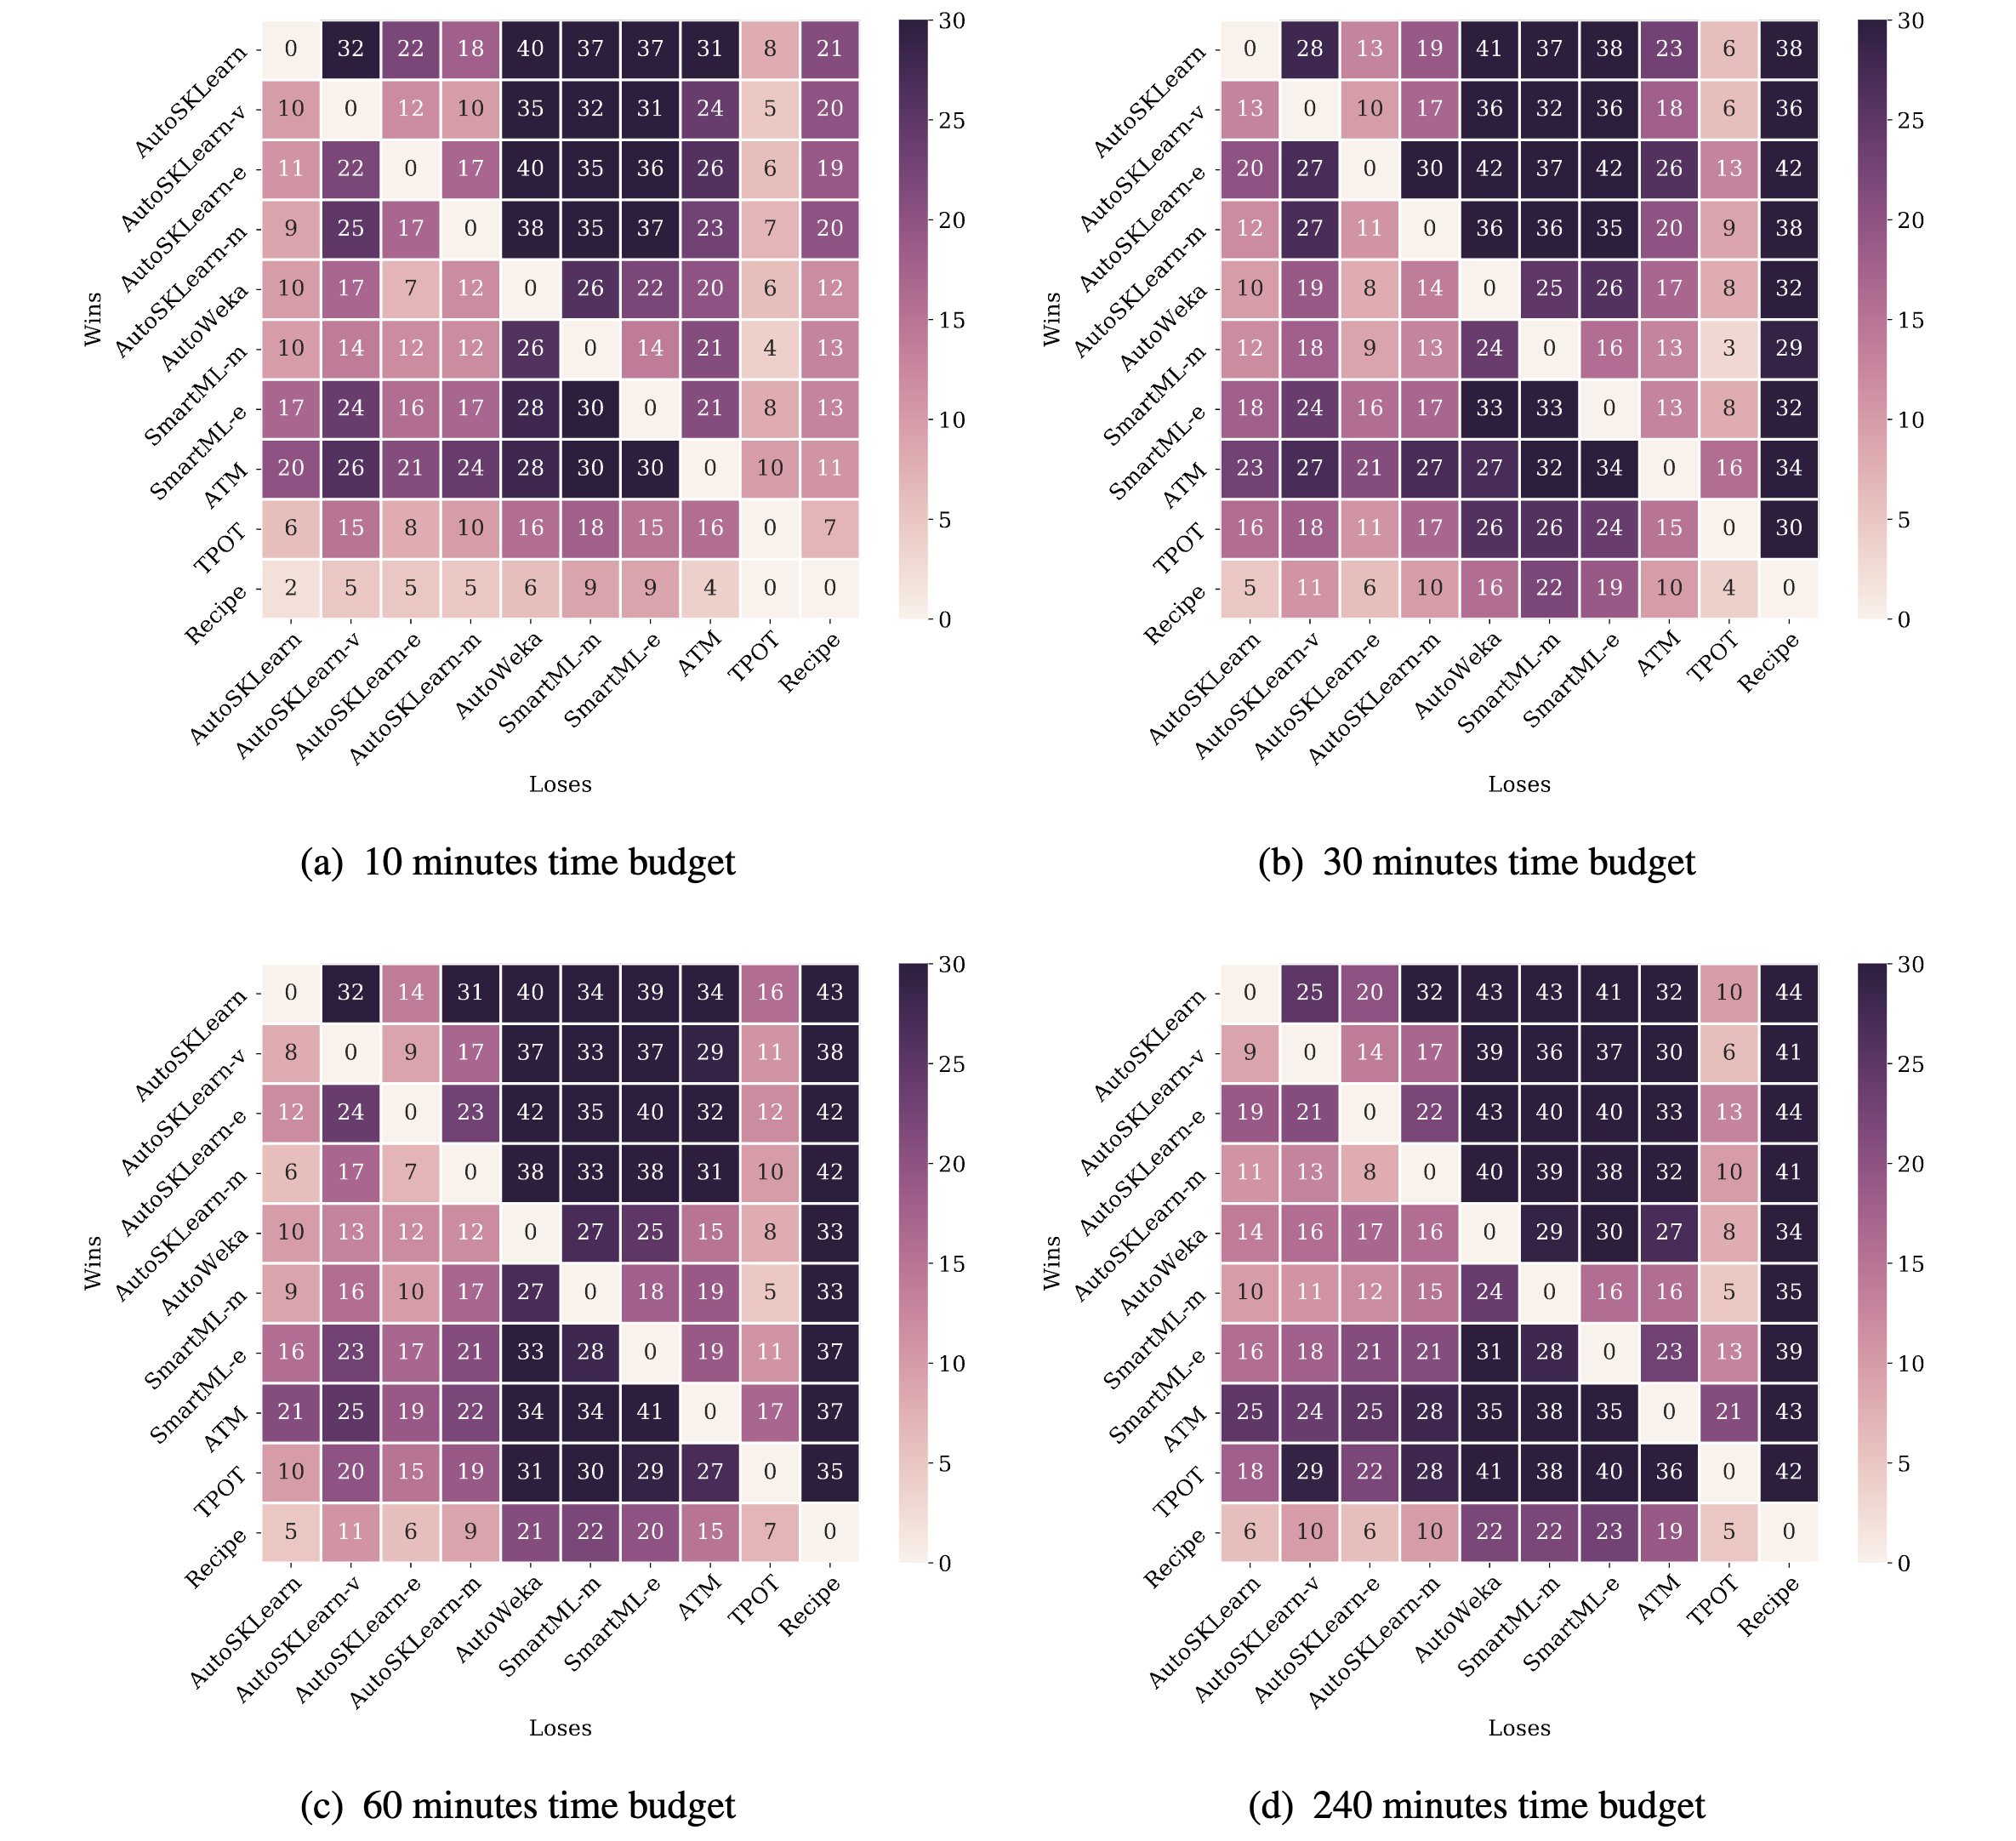
Number of successful runsPerformance of the final pipeline per AutoML framework for 240 minutesHeatmaps show the number of datasets a given AutoML framework outperforms another in terms
of predictive performance over different time budgets. Two frameworks are considered to have the same
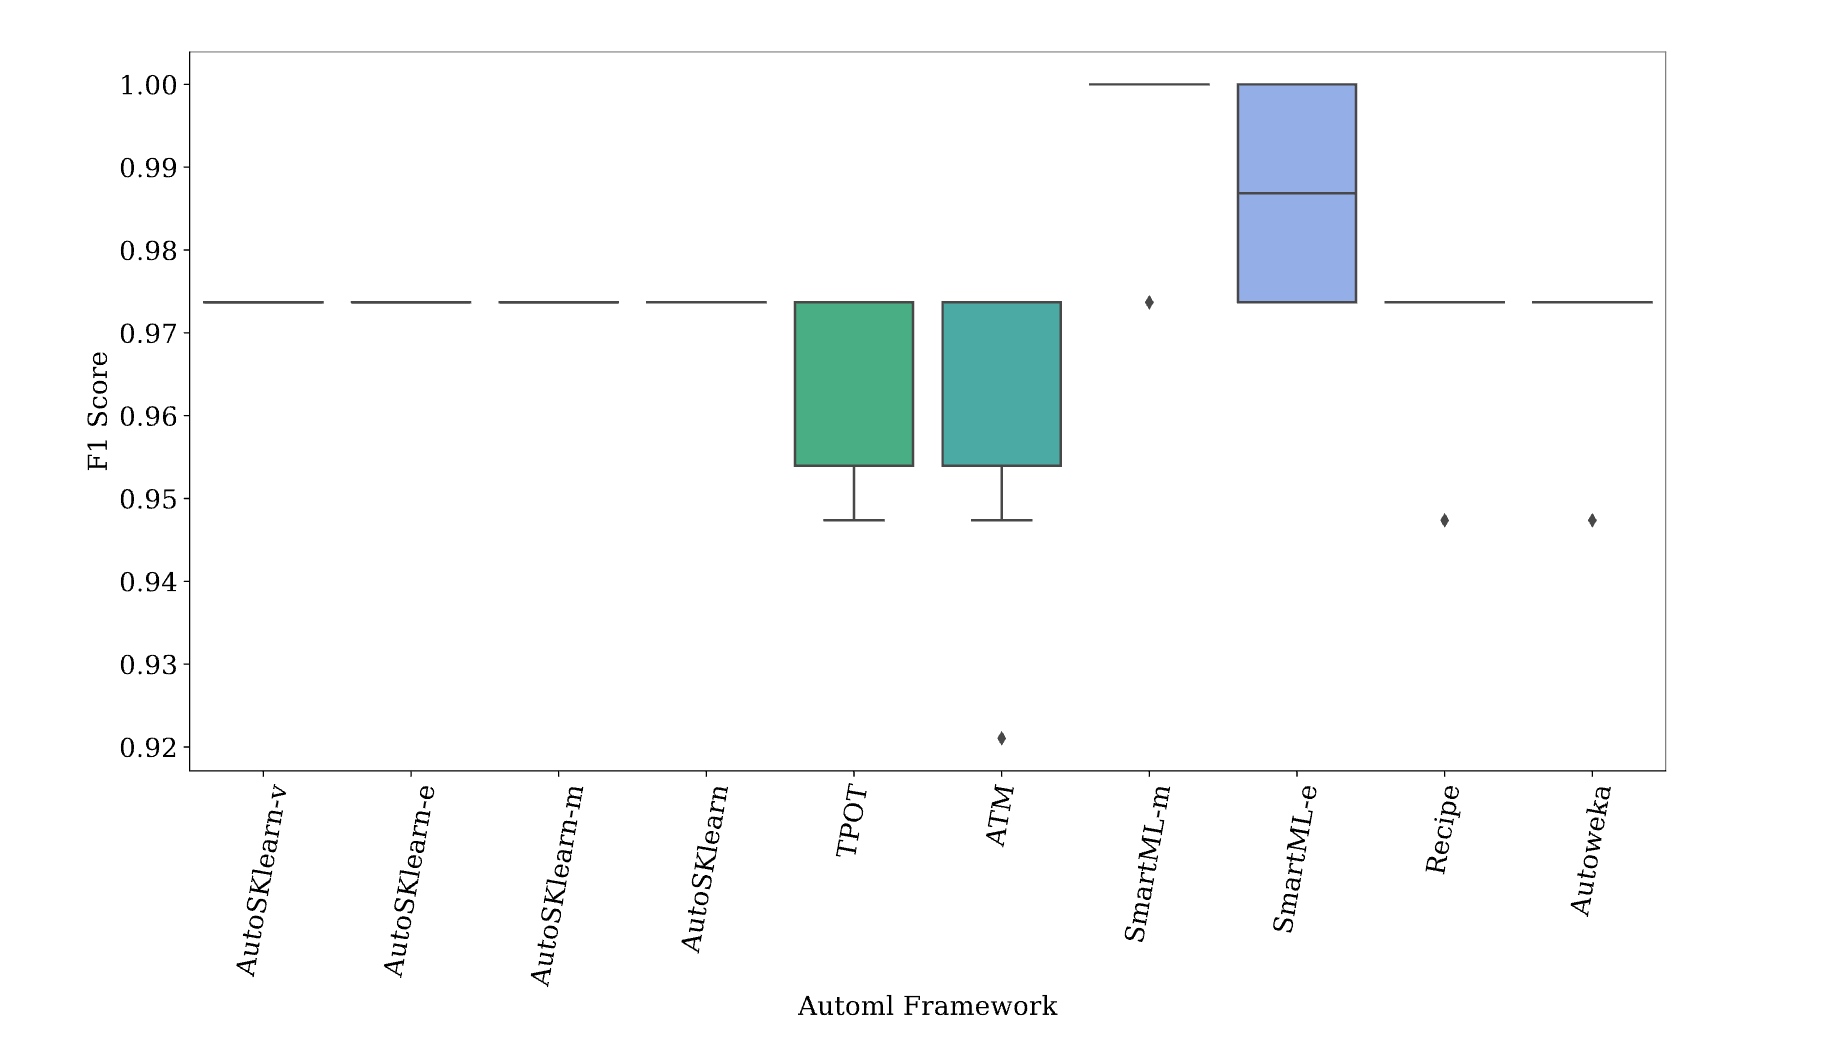
performance on a task if they achieve predictive performance within 1% of each other.Performance of the final pipeline on multi-class classification tasksPerformance of the final pipeline on datasets with large number of features and small
number of instances.Performance of the different AutoML frameworks based on the various characteristics of datasets
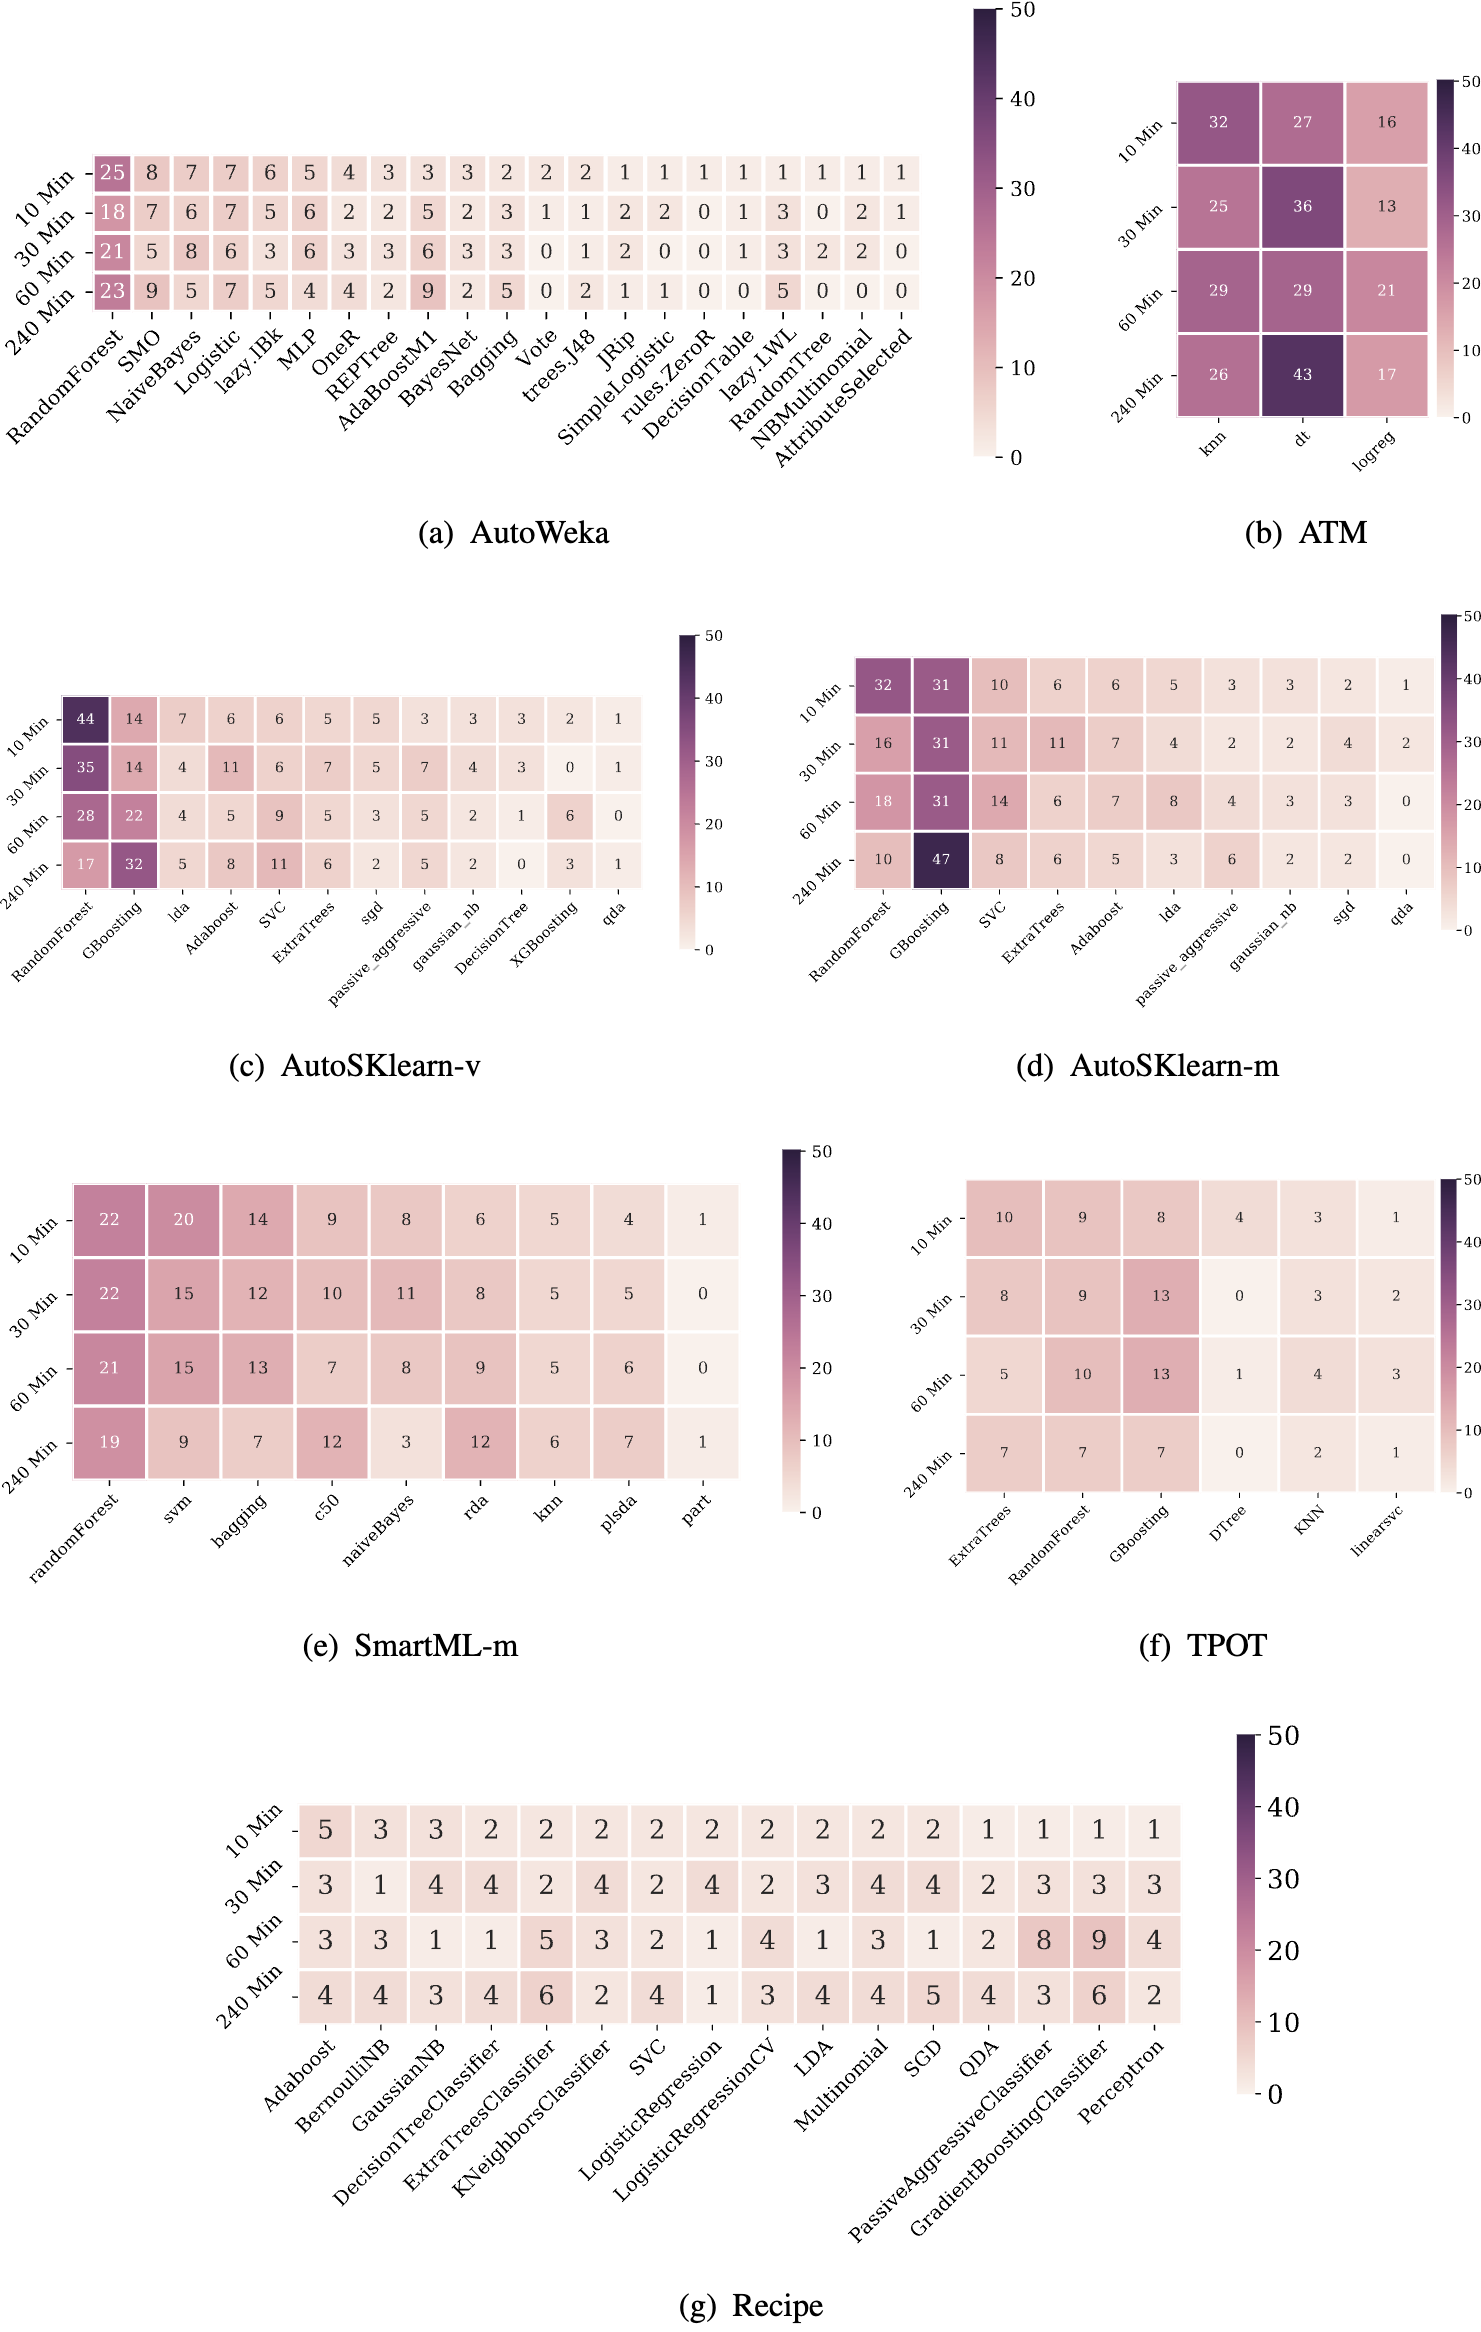
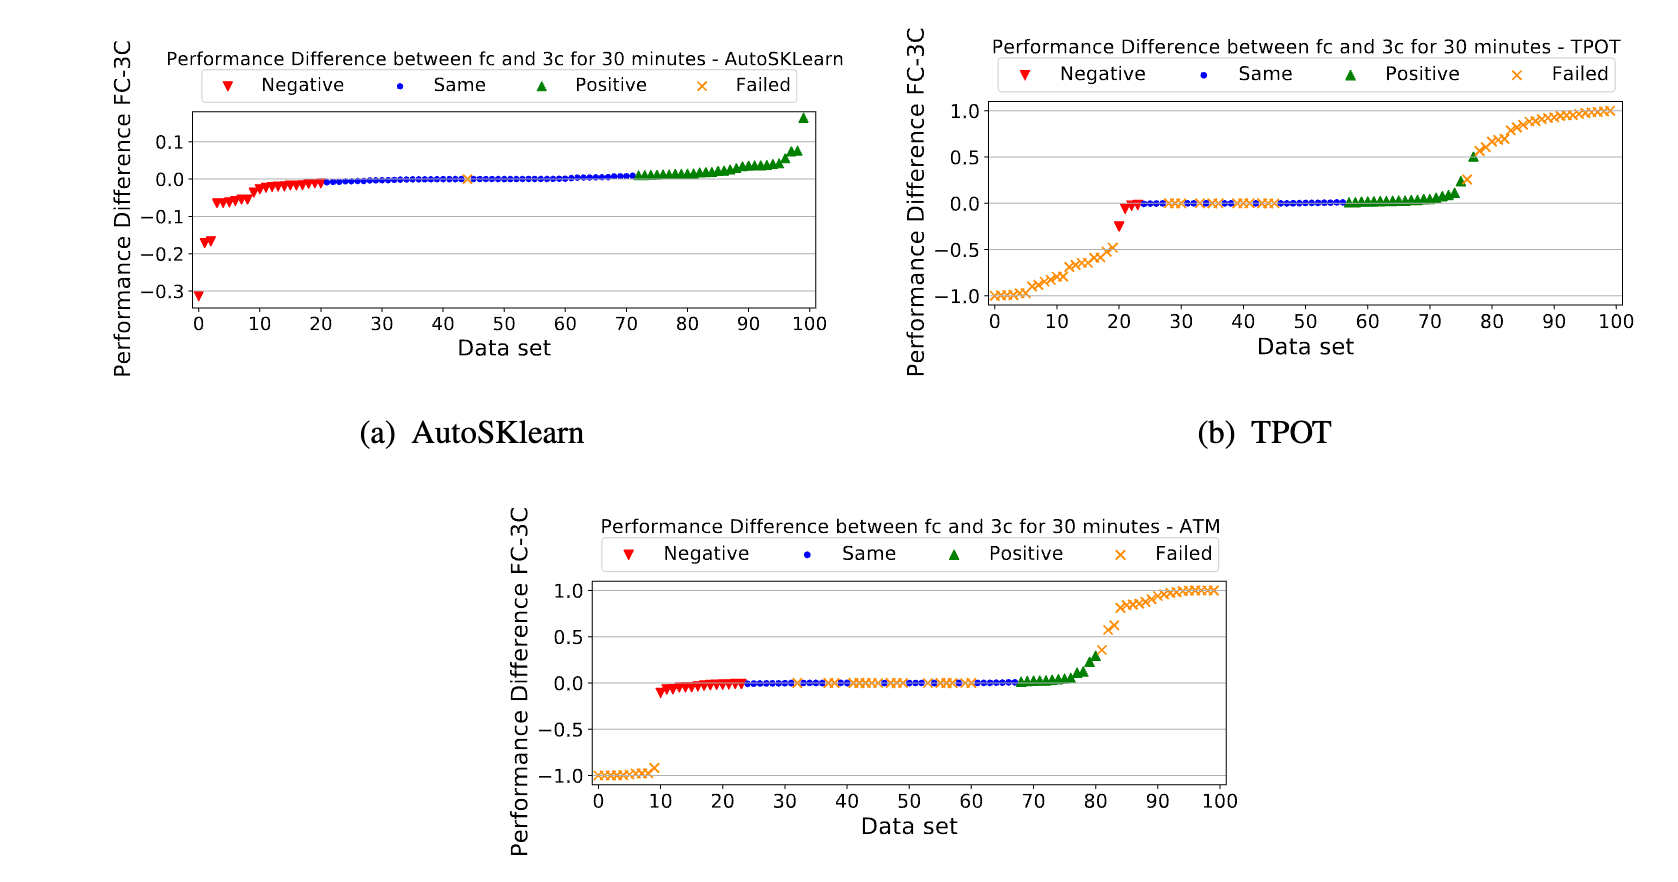
and tasks over 240 minutes.Evaluation of AutoML frameworks on robustnessThe frequency of using different machine learning models by the different AutoML frameworks.The impact of using a static portfolio on each AutoML framework. Green markers represent better
performance with F C search space, blue markers represent comparable performance with a difference
less than 1%, red markers represent better performance with 3C search space, yellow markers on the left
represent failed runs with F C but successful with 3C, yellow markers on the right represent failed runs
with 3C but successful with F C, and yellow markers in the middle represent failed runs with both F C
and 3C